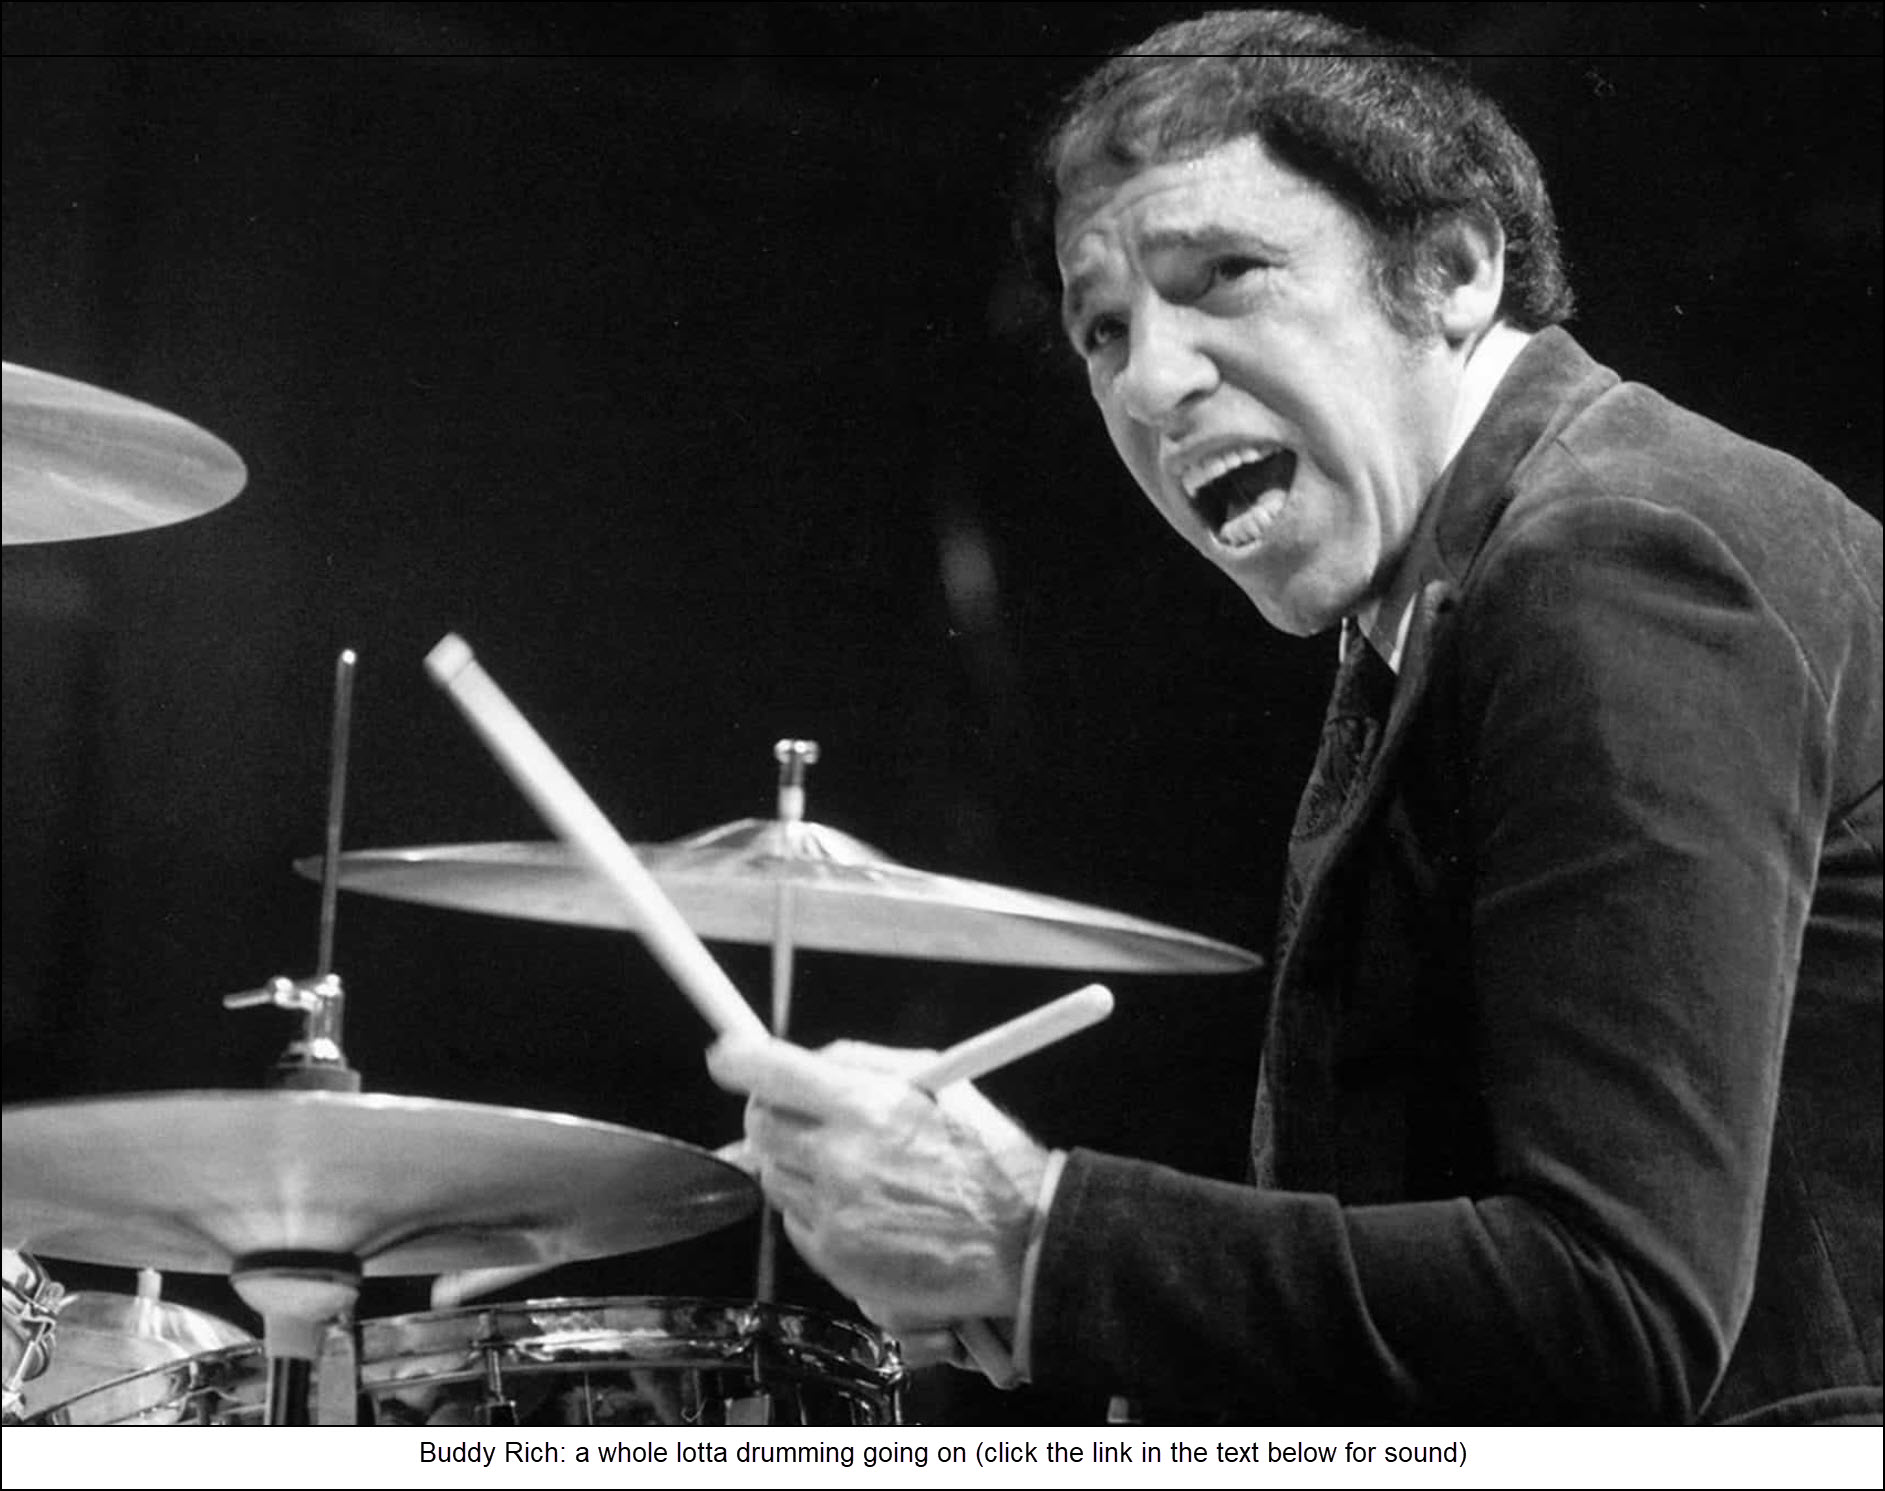
The Morning Line

Microsoft’s Plunge Pricks AI Bubble

0 comments

Pity the J-school rookies who are paid to explain why the stock market did what it did on a given day. On Thursday, Microsoft shares lost nearly a half-a-trillion dollars of value. But why? Bloomberg’s Evening Briefing called it a ‘rap on the knuckles’ for the company’s huge spending on AI projects that seem increasingly unlikely to pay off. But isn’t a rap on the knuckles the way nuns used to deal with minor behavioral lapses in young boys? If so, then Microsoft deserved 40 lashes with a rattan cane. Although the story was treated by the hacks who wrote it as a news event, what it portends is nothing short of financial calamity, reported in daily installments. For it is not just Microsoft that has squandered hitherto unimaginable sums on failing AI projects, but a dozen other corporate behemoths, including lunatic-sector (aka ‘Magnificent Seven’) stalwarts Amazon, Google, Facebook, Nvidia and Tesla.

Analysts have projected total global AI spending of $2.6 trillion across all companies and markets in 2026. Here’s where the math gets interesting. Microsoft share of those outlays would be an estimated $140 billion. Investors knocked three times that from the company’s valuation last week, while also imploding the world’s gaseous ‘wealth effect’ by a rich but still-invisible multiple. If equal punishment were to be inflicted on the companies planning to spend the $2.6 trillion, the haircut would amount to nearly $8 trillion. That is arguably the approximate size of the AI deflation that lies just ahead, and it will activate a black hole that could double or triple losses in other classes of investible assets. Treasury paper will go bounding in the other direction, finally getting some respect as a safe haven.

When to Take Heart

Granted, neither the math nor the logic is airtight. But the $8 trillion guesstimate is probably more credible than the rap-on-the-knuckles summation offered by Bloomberg. Their reporters are too lazy and too poorly trained to attack the real story, which will soon spread far beyond Microsoft. As it develops, and stocks begin to fall with increasing momentum, the op-ed columnists will catch the scent of panic and write more explicitly about the AI bubble’s collapse. Reporters will eventually follow suit, and that’s when you can take heart,  since the bear market will be half-way to a bottom by then. (Click here for my latest interview — “Let it all hang out!” — with Jim Goddard at Howe Street.)

Rick's Picks for Tuesday
$ = Actionable Advice + = Open Position
Search touts by symbol

$MSFT – Microsoft (Last:430.29)

0


Rick’s Picks Member-only content.You must be logged in to view this post

$ESH26 – March E-Mini S&P (Last:6961.25)

0


Rick’s Picks Member-only content.You must be logged in to view this post

$GCJ26 – April Gold (Last:4779.10)

0


Rick’s Picks Member-only content.You must be logged in to view this post

$SIH26 – March Silver (Last:85.395)

0


Rick’s Picks Member-only content.You must be logged in to view this post

$GDXJ – Junior Gold Miner ETF (Last:124.09)

0


Rick’s Picks Member-only content.You must be logged in to view this post

$HGH26 – March Copper (Last:5.9240)

0


Rick’s Picks Member-only content.You must be logged in to view this post

$TYX.X – 30-Year T-Bond Rate (Last:48.72)

0

TLT has done nothing to alleviate a dismal picture on the long-term charts. I am switching the view this week to a chart of long-term Treasury rates which points toward 5.078%.  It would be the first time they’ve traded above the psychologically important 5% level since July, when a peak at 5.077% was recorded. My gut feeling is that anything that close to last May’s watershed  5.153% would be tested and exceeded, putting Trump’s plans to stimulate the economy in jeopardy. His lips have been pushing hard against the uptrend in yields, but market forces seem to be winning.

This is a free forecast (Tout) by Rick. Get a free trial of Rick’s Picks to see full member content.

$DJIA – Dow Industrial Average (Last:49,047)

The chart is featured in the current commentary, but let me add a cautionary note for subscribers only. The 50K milestone that lies just a hair above Friday’s record settlement closely coincides with the 49,355 ‘D’ target of the pattern shown in the inset. My gut feeling is that the so-far slight overshoot of the target happened because traders were intent on hitting 50K regardless of any Hidden Pivots that may have stood in the way. We should infer in any case that there is double stopping power here, and that a significant pullback is distinctly possible, even if it turns out not to have been the start of a bear market. Since we should always have a higher target ready just in case, the 53,022 Hidden Pivot noted in the upper-right corner of the chart can serve that purpose. Assume it will be achieved if the Indoos close for two consecutive weekly bars above 50,600. _______ UPDATE (Jan 30):  The Dow has been jerking bears’ chains with a Wile E. Coyote dance inches from the potential top I’d warned about at 50,000. Sellers will need to penetrate the red line (p=48,270), however, before I can diss this gas-bag with enthiusasim and still sound credible.  Even then, it would be a good bet to fall no further than D=46,918, hinting that the broad averages, unlike bullion, are in shallow correction that will cause little pain or even anxiety.

This is a free forecast (Tout) by Rick. Get a free trial of Rick’s Picks to see full member content.