
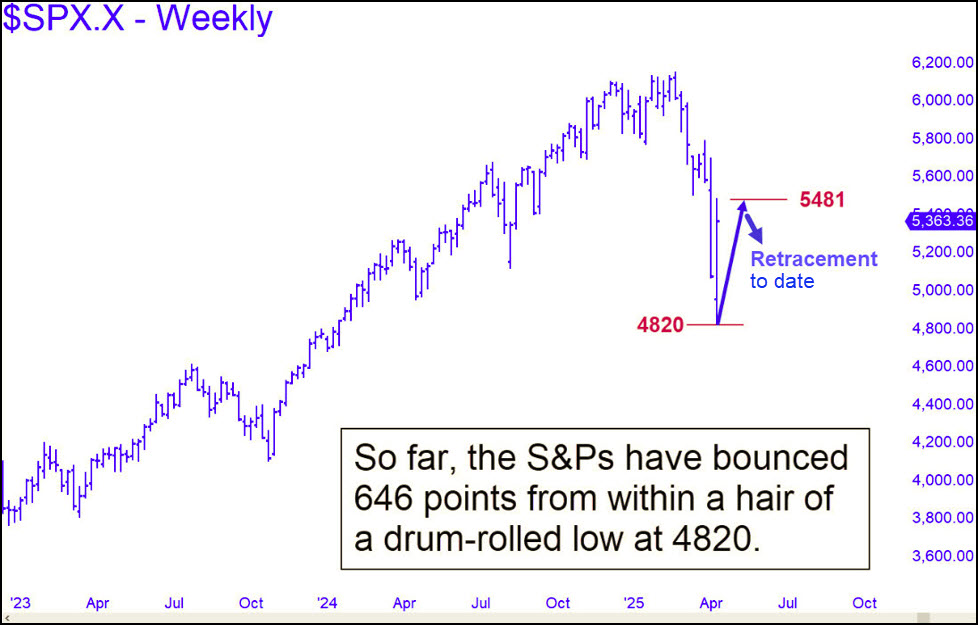
[Two weeks ago, I made the seemingly outrageous prediction that Trump’s tariff offensive would not cause a recession and that the stock market bear would soon be over. Shares were in a steep plunge at the time, and investors around the world seemed ready to hit the panic button that Sunday night. The S&Ps had last traded around 5300, but my technical runes said they would fall no lower than 4820, even with traders in the grip of fear. Lo, the SPX fell no lower than 4835 on Monday, then bounced a whopping 646 points. Although they’ve since given back some of the gains, they are still 447 points above the low and showing little inclination to test it. That could change, of course, and stocks could relapse with a vengeance. If so, it would likely put the U.S. and global economies on a path toward deep recession, or even a Second Great Depression. That is what I might have expected if the 4820 target hadn’t looked so promising as a support. We shall see. In the meantime, I’ll continue to run my original commentary (see below) until the stock market proves me wrong. It is either going to new highs by summer, or about to resume a historic crash. RA ]
***
A word of advice if you’re looking for bankable information on the direction of the economy: tune out the mainstream media’s cavalcade of Trump-deranged bozos and focus on the 4820 target in the SPX chart above. Think of it as Trump’s lucky number, but also a very good place for these all-too-interesting times to find temporary equilibrium. That is my worst-case target for a bear market that many believe is only just getting started. As a die-hard permabear myself, I’ve been eagerly anticipating the Mother of All Bears since, like, 2010. The global economy was badly in need of a reset and still is. It will happen, but not now. Instead, it looks like Trump is about to achieve the impossible, averting a catastrophic debt deflation while also staving off recession. Even the already certain collapse of commercial real estate will have to wait.
You cannot get to this happy place, psychologically speaking. if you stay tuned to the MSM morons who invent the news. You might as well listen to Whoopi Goldberg as to the “experts” who cover tariff news for MSNBC, The New York P.O.S. Times and Bloomberg. Bloomberg is probably the worst offender, since they literally live to kick Trump in the balls at every opportunity. (Don’t they know he’s wearing a Kevlar cup?) The latest Bloomberg teaser headline sums up the mainstream media’s knee-jerk reaction to the Orange Man: Trump’s Bear Market. Leave it to Bloomberg’s sniveling lightweights to discover and attempt to exploit a bear market just as it’s ending. Indeed, the storm surge is due to blow out to sea before the news editors at Bloomberg, the Times and WAPO have reached the Kleenex phase of their long-running circle jerk.
Christmas Glide Path
Tune them out and trust my 4820 target as a worst-case low for the bear market. To borrow Vizzini’s line, it is ‘INCONCEIVABLE!’ that the S&Ps will fall significantly below it, if at all. And that means Trump, Musk and their intrepid band of budget vigilantes will have put America back on a glide path just in time for Christmas. In other words: no recession, no harmful fallout from the tariffs, and no serious disruptions from lawfare shit-stain Norm Eisen and other treasonous actors hell-bent on destroying the U.S. through the courts. Far from a tariff-induced recession, watch for felicitous stirrings in the Rust Belt, where union workers will be telling a very different story compared to the ‘Orange Man BAD!‘ narrative on MSNBC and CNN.
If you’re interested in precise bear market targets for the ‘lunatic-sector’ stocks, take a free trial to Rick’s Picks and see my post on this in the chat room, or find them in my latest interview on Howe Street. Prepare to have your mind blown three months from now by the precise accuracy of my forecasts for climactic declines in NVDA, TSLA, AAPL, MSFT, GOOG, NFLX, CMG, META and AMZN.