
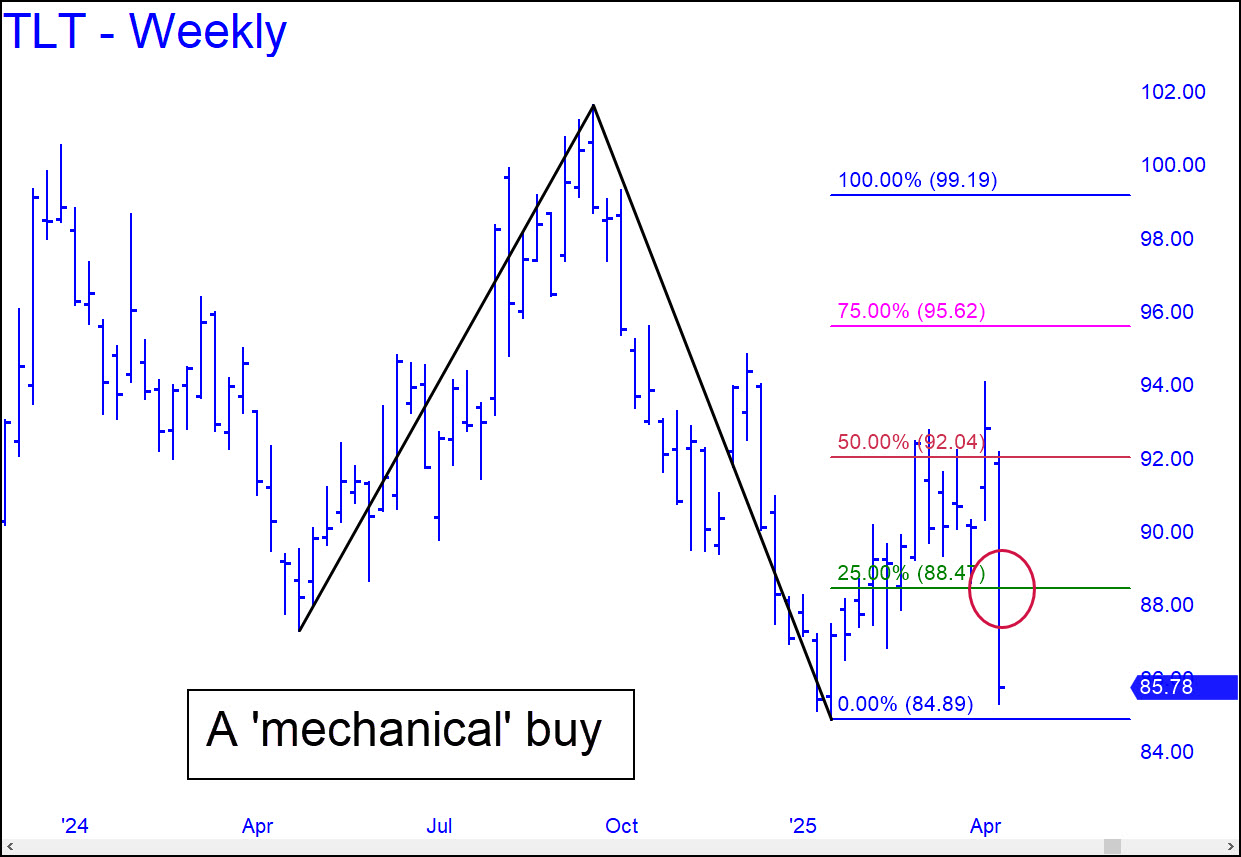
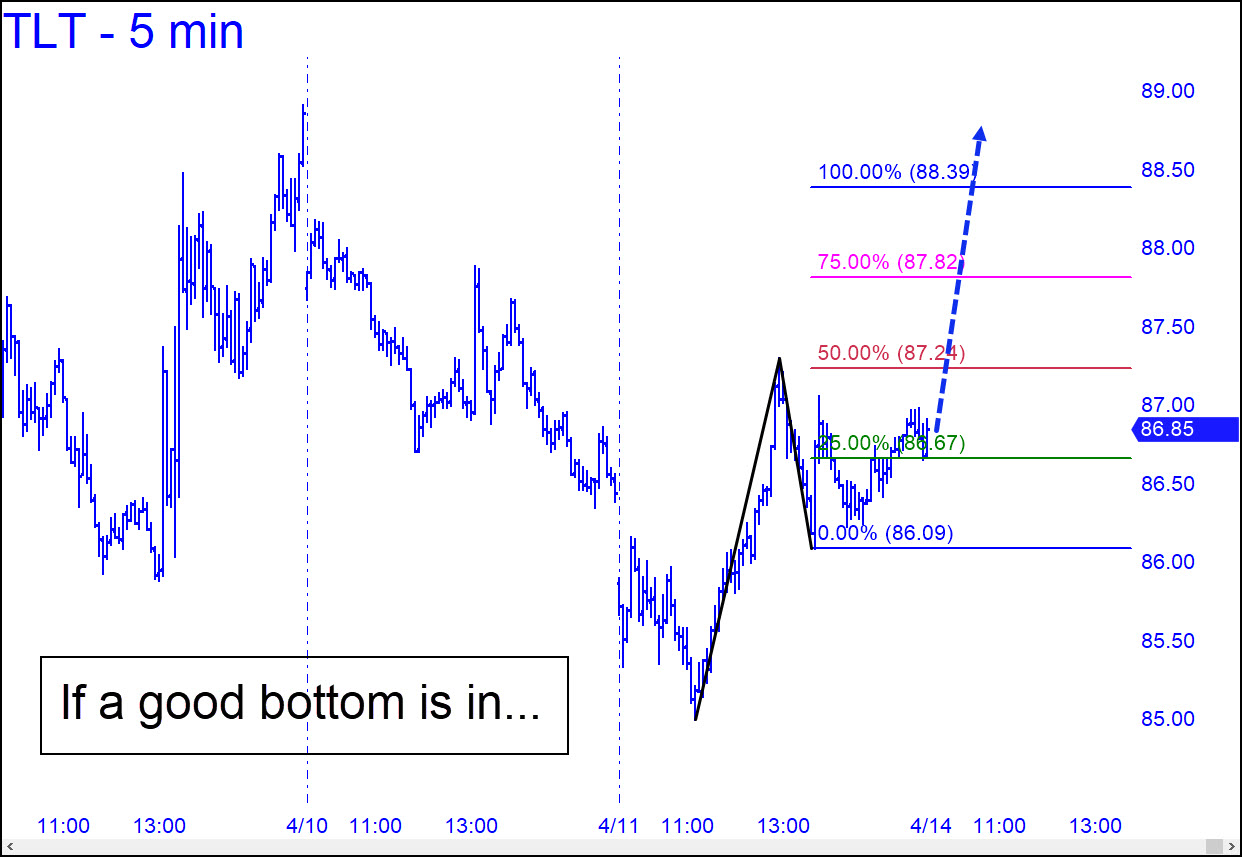
 Despite the hellacious dive over the last ten days, TLT is on a double buy signal. The more important of the two is shown in the weekly chart (inset). An 88.47 bid would require a stop-loss at 84.88, just beneath the pattern’s point ‘c’ low. You can see how close the low came to stopping out the position, but it held nonetheless — by 12 cents. T-Bonds were bound to turn around sooner or later, and the chart says this would be a logical place for it to happen. Odds that a major low is in place would shorten if this so-far modest bounce can push past D=88.39 of this minor pattern.
$TLT – Lehman Bond ETF (Last:86.65)
Posted on April 13, 2025, 5:21 pm EDT
Last Updated April 12, 2025, 12:57 pm EDT