
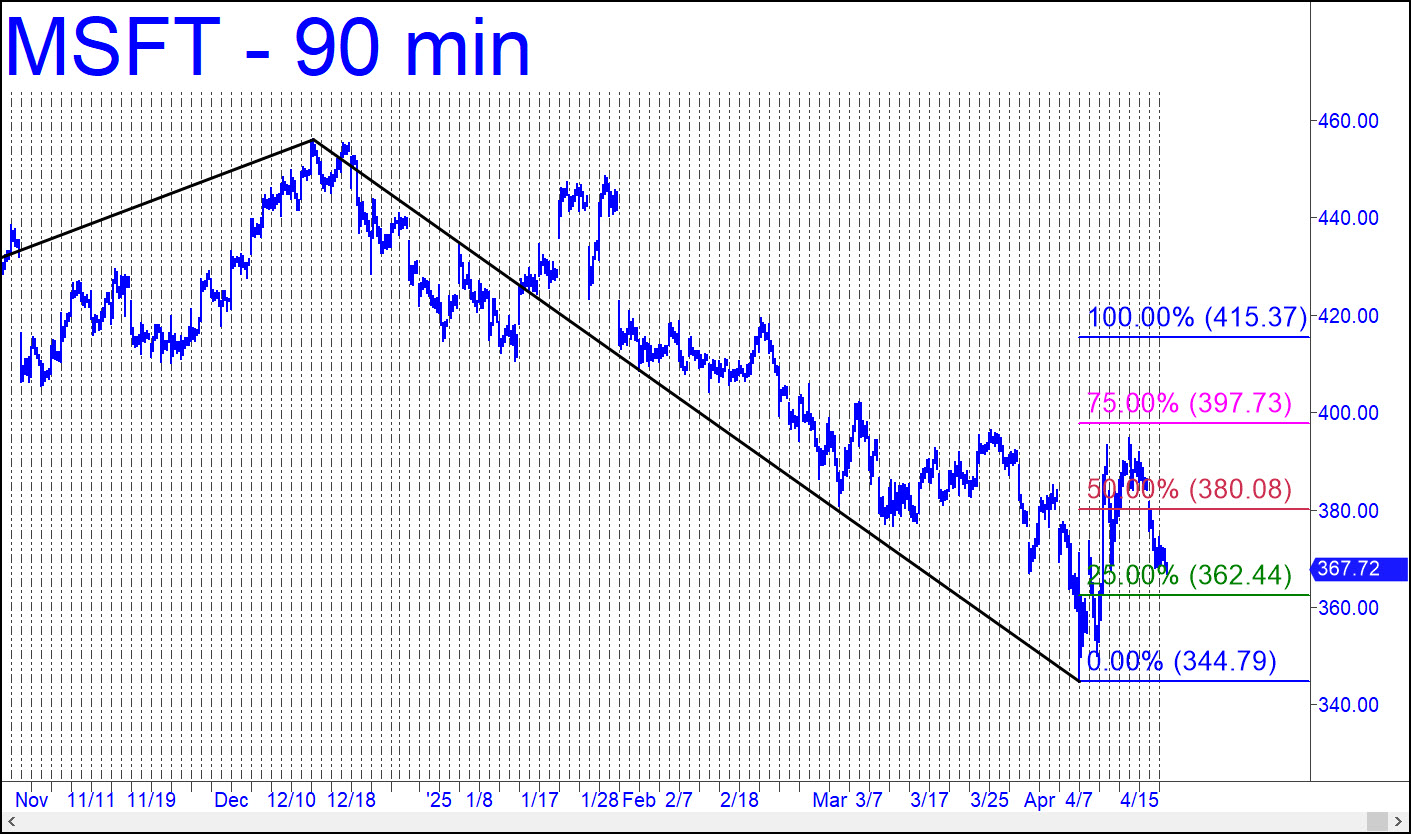
 There are idiosyncratic reasons for selecting the reverse pattern shown, but its main purpose is to bring visual clarity to the ‘mechanical’ buy signal that would trigger if MSFT touches the green line (x=362.44), which it almost certainly will. I was unable to drag the ‘a’ low into the picture, but if you want to replicate the chart, it lies at 385.58 (8/5/24). There’s plenty of potential here, although I would find a way around the textbook stop-loss at 344.78. A ‘camo’ trigger fashioned from the 5-minute chart would allow you to test the water without risking more than relative pocket change.
$MSFT – Microsoft (Last:367.72)
Posted on April 20, 2025, 5:19 pm EDT
Last Updated April 17, 2025, 11:45 pm EDT