
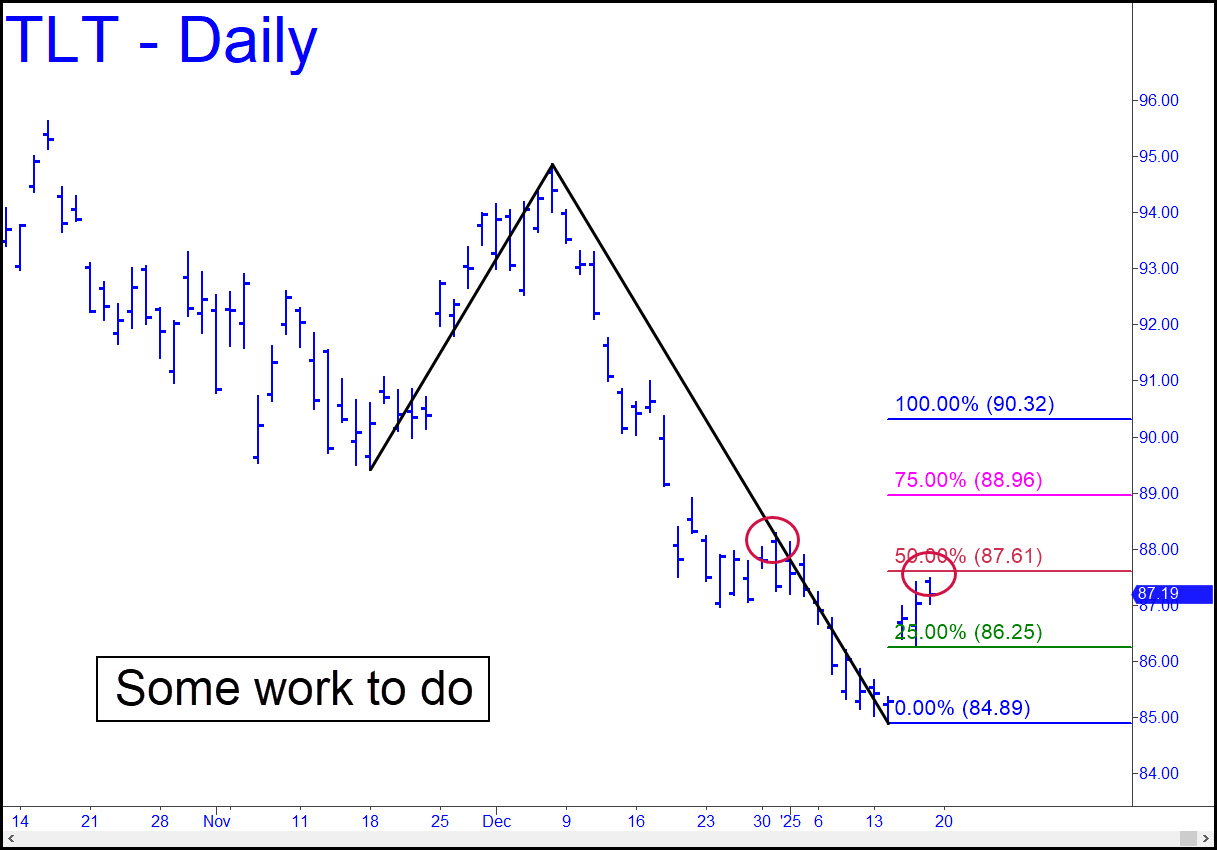
 Is this move for real? I doubt it, but we’ll let the chart tell us what to think. So far, last Wednesday’s bear-trap opening looks only superficially impressive, since the follow-through failed to get past the 87.61 midpoint resistance (p=87.61) shown in the chart. TLT is a lock-up to reach it, but the upthrust would still need to vault an ‘external’ peak at 88.28 recorded on December 3 to demonstrate staying power. A decisive move through p would shorten the odds that d=90.32 will be reached while also lending credibility to the rally. If it is more than just flash-in-the-pan, performance measured against this pattern cannot but tell us the story.
TLT – Lehman Bond ETF (Last:87.07)
Posted on January 19, 2025, 5:12 pm EST
Last Updated January 19, 2025, 3:26 pm EST