
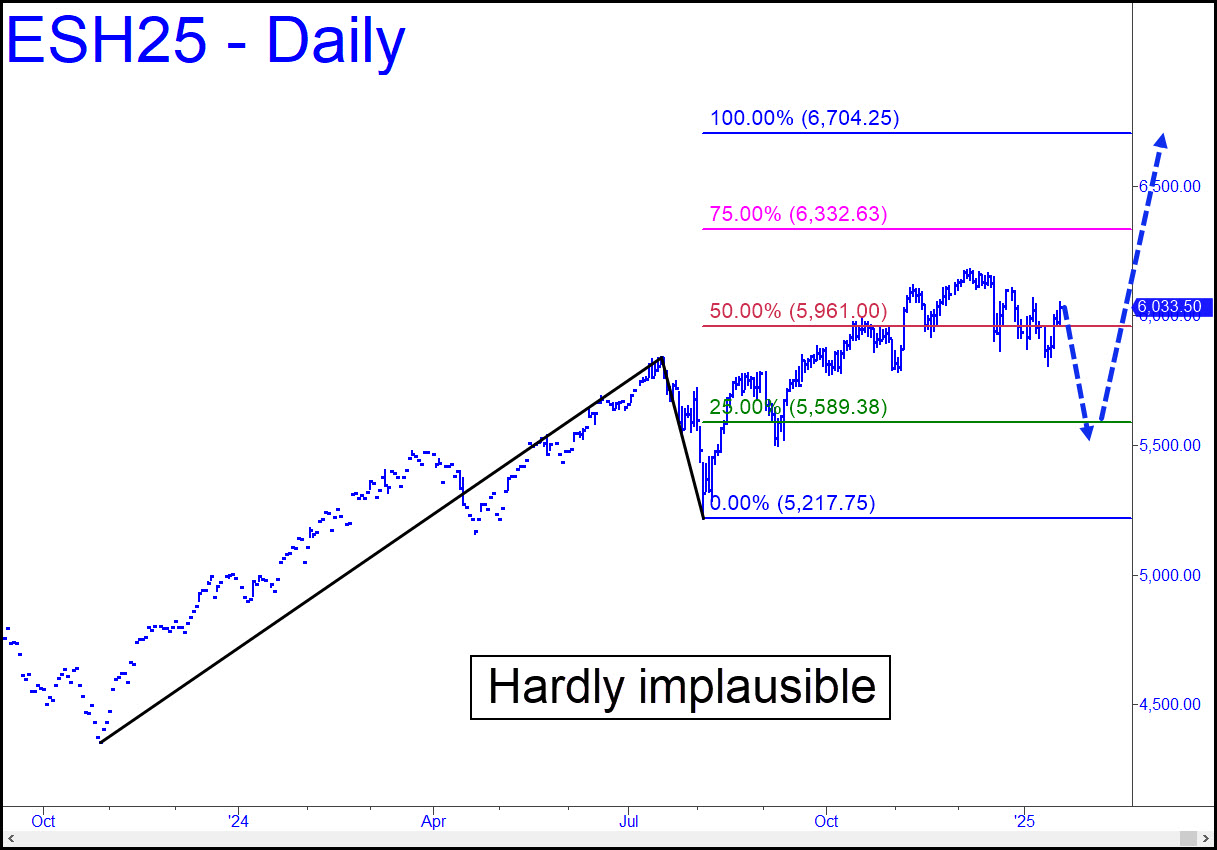
 The chart shows a possible path to as high as 6704.25, about 11% above current levels. Although it would seem to flout the solidly bearish implications of a longer-term SPX chart I presented here recently, the two can be reconciled by allowing most immediately for a hard selloff to the green line. That would set the stage for a powerful rally, although not necessarily one that would reach the D target. We’ll worry about that when the time comes, but anyone who has watched dozens of ‘mechanical’ trades unfold in various time frames will see nothing unusual in the way I’ve drawn this chart. To avoid muddling the two scenarios, let me note that the more bearish one looks like a 70% shot, meaning this is probably THE top, even if it becomes a raggedy one.
ESH25 – March E-Mini S&Ps (Last:6033.5)
Posted on January 19, 2025, 5:00 pm EST
Last Updated January 17, 2025, 11:24 pm EST