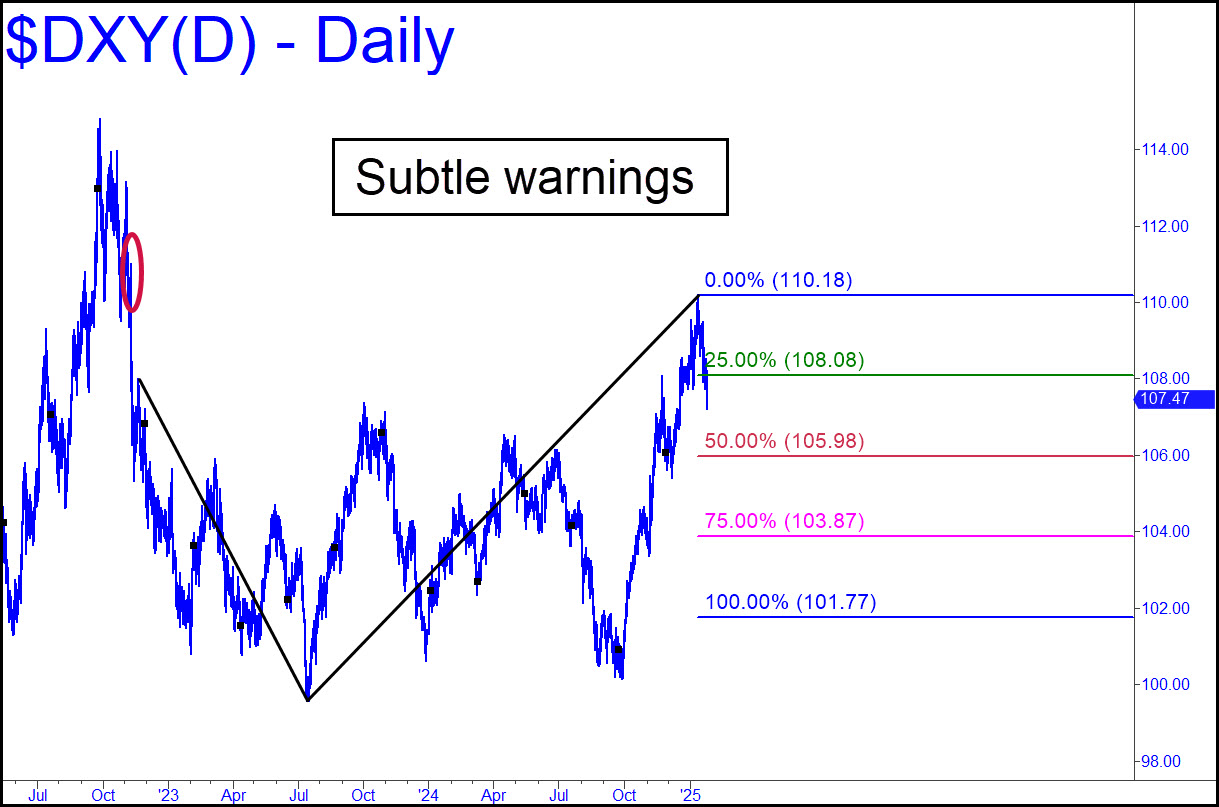
 I shrugged off a remark in the chat room that the Dollar Index did not exactly follow my bullish script last week. I noted at the time that the long-term trend is unambiguously bullish, and that the rally from October’s low has been nothing short of spectacular. However, when I looked very closely at the chart while preparing this tout, there were some subtle signs of possible trouble. For one, the most recent rally peak failed to surpass any external peaks. I’ve circled the closest on the chart, a look-to-the-lefter so subtle that it is not even visible in the SnagIt reproduction. Nevertheless, a basic rule of my system is that healthy rallies must exceed at least one prior peak with each upthrust, and this one didn’t. Also, notice that the selloff from last week’s 110.18 high triggered a theoretical ‘sell’ signal when it breached the green line (x=108.08). We should take this seriously because the reverse pattern itself, although highly unorthodox, comprises three ‘locked’ coordinates whose authority cannot be denied. The implication is that DXY may have begun a fall that could take it all the way down to 101.77. If so, that would be quite bullish for gold.
DXY – NYBOT Dollar Index (Last:107.47)
 Posted on January 26, 2025, 5:22 pm EST
Last Updated January 24, 2025, 10:23 pm EST
