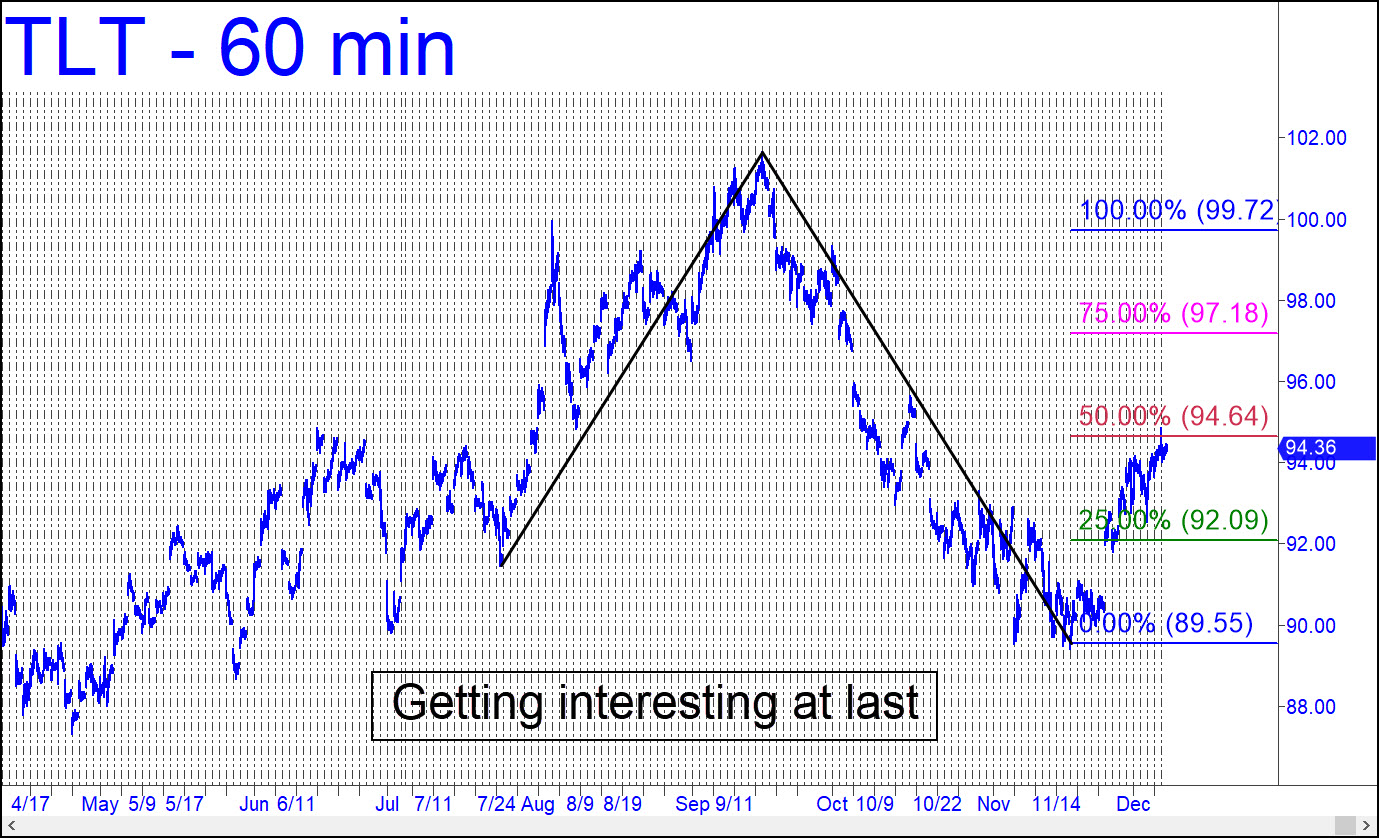
 The weekly chart I posted last week set a high bar for bulls. I’ve downsized this week to the hourly chart, which shows TLT about to test the resistance of a Hidden Pivot midpoint at 94.64. The rally has come far enough since November’s sub-90 low to warrant the benefit of the doubt. As always, a two-day close above the red line or a decisive penetration of it would imply more upside to at least p2=97.18 or even to d=99.72).
TLT – Lehman Bond ETF (Last:94.36)
 Posted on December 8, 2024, 5:17 pm EST
Last Updated December 7, 2024, 2:51 am EST
