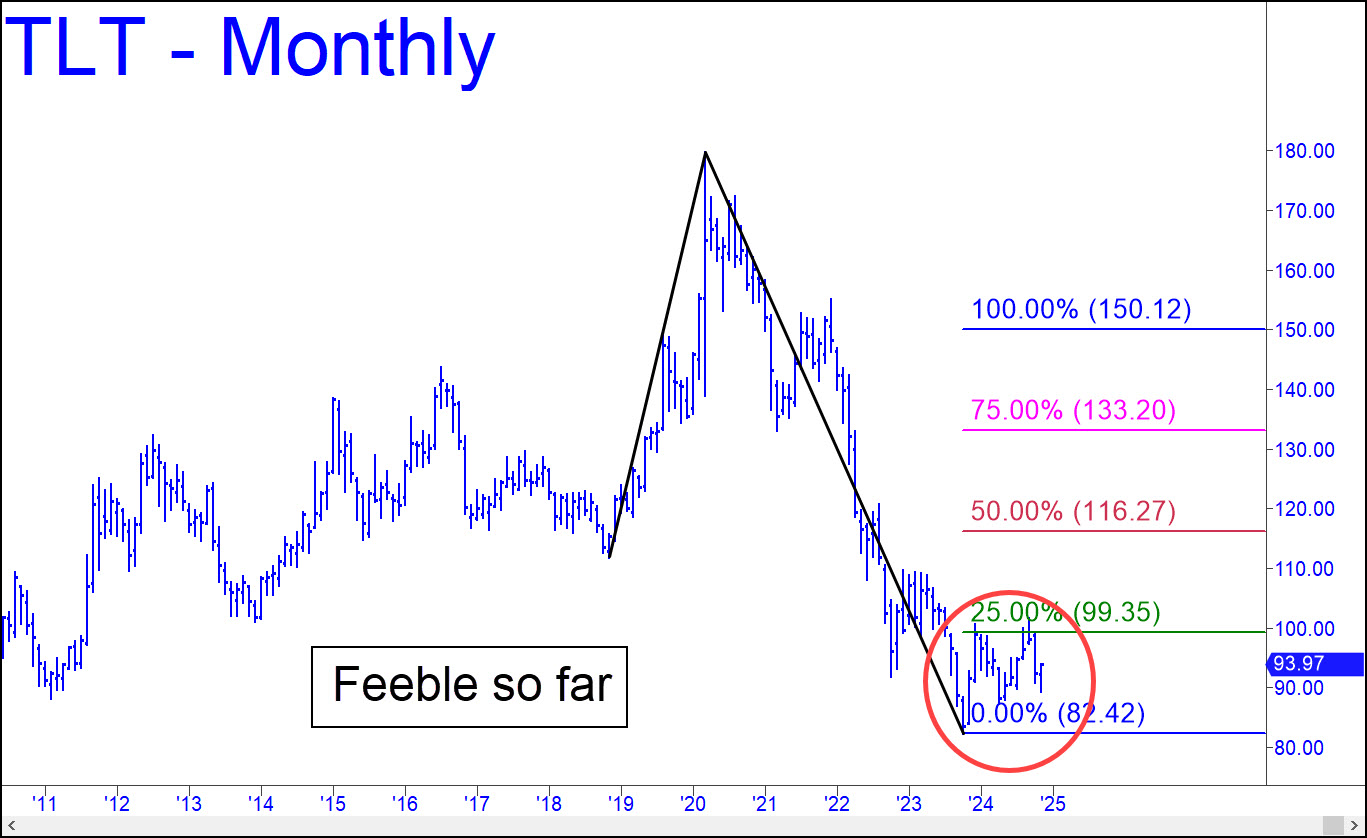
 The big pattern shown in the inset is too ambitious to frame the so-far timid gyrations that have lifted T-Bonds from their bear-market low. However, I have used it anyway because lesser charts magnify TLT’s indecisiveness even more. Regardless, the gyrations have triggered a theoretical ‘buy’ signal that will require a follow-through to at least p=116.27 for validation, TLT is tradable in the meantime, but only by way of short-term signals on the intraday charts. A breach of c=82.42 would be discouraging news for the few bond bulls who have bucked the tide, although not necessarily for those who have been waiting for a washout to load up the truck.
TLT – Lehman Bond ETF (Last:93.97)
 Posted on December 1, 2024, 5:10 pm EST
Last Updated December 3, 2024, 7:18 pm EST
