
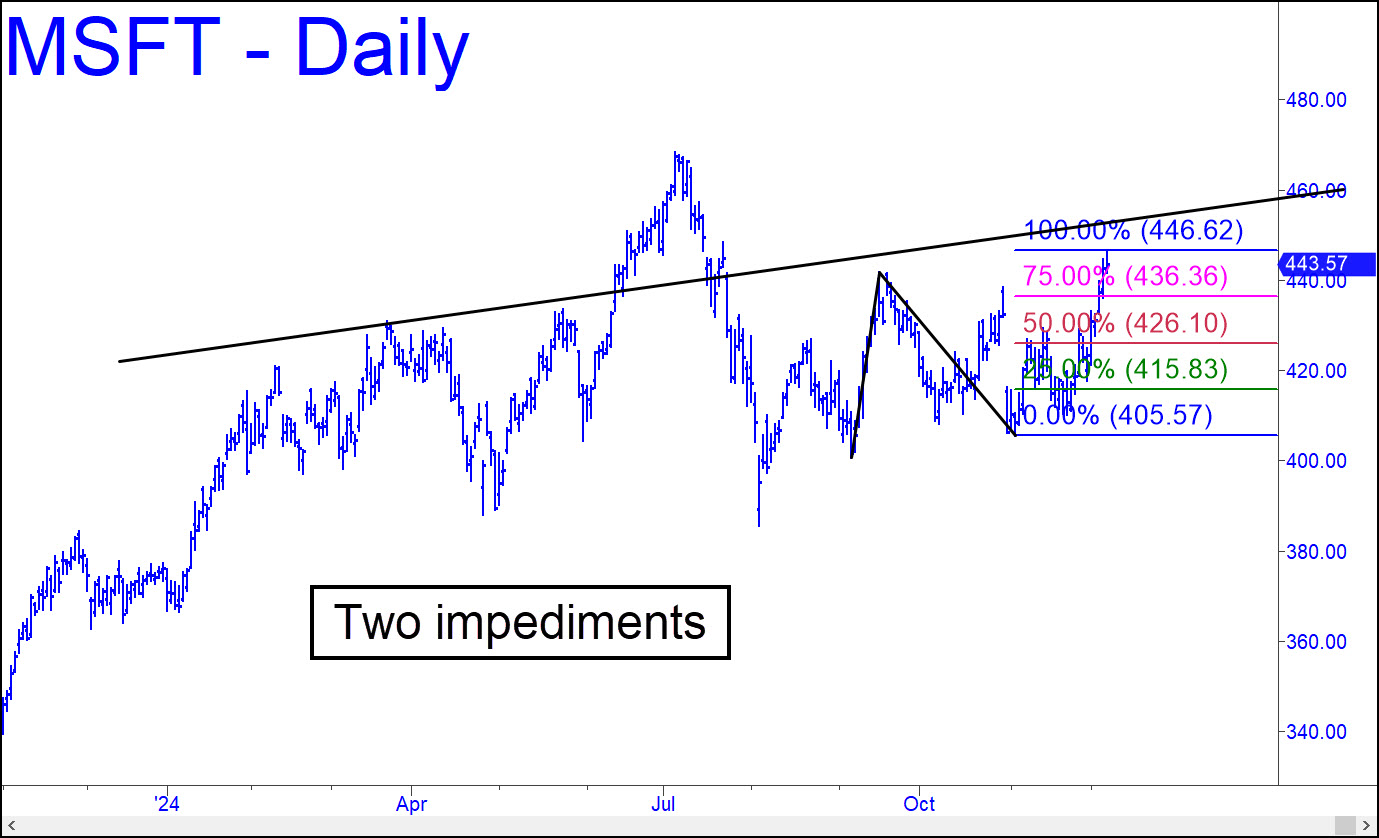
 The chart shows two invisible impediments that could trip up bulls this week. The first lies at 446.62, the D target of a conventional pattern begun from 400 in early September. The second is a trendline resistance from a head-and-shoulders pattern that will come in around 455. Together, these potential rally-stoppers represent thick layers of supply between current levels and July’s record 468. The oddity is that until July MSFT had been leading the market higher. Is it about to resume that role after underperforming lunatic-sector stocks for the last several months? We should be ready for this possibility in any event, so stay tuned for updates in the days ahead. _______ UPDATE (December 12, 10:45 a.m.): A diabolically sick time for MSFT to be short-squeezing higher just when the lunatic sector is coughing and wheezing itself to death. One could almost believe the chimpanzees who purport to ‘manage’ money actually do meet in a smoke-filled room to plot each gratuitous, stupid sector rotation. If the stock hits 460, I’ll throw in the towel on that promising head-and-shoulders pattern that has perfectly defined and controlled the stock’s ups and downs for the entirety of 2024.
MSFT – Microsoft (Last:453.57)
Posted on December 8, 2024, 5:19 pm EST
Last Updated December 12, 2024, 1:43 pm EST