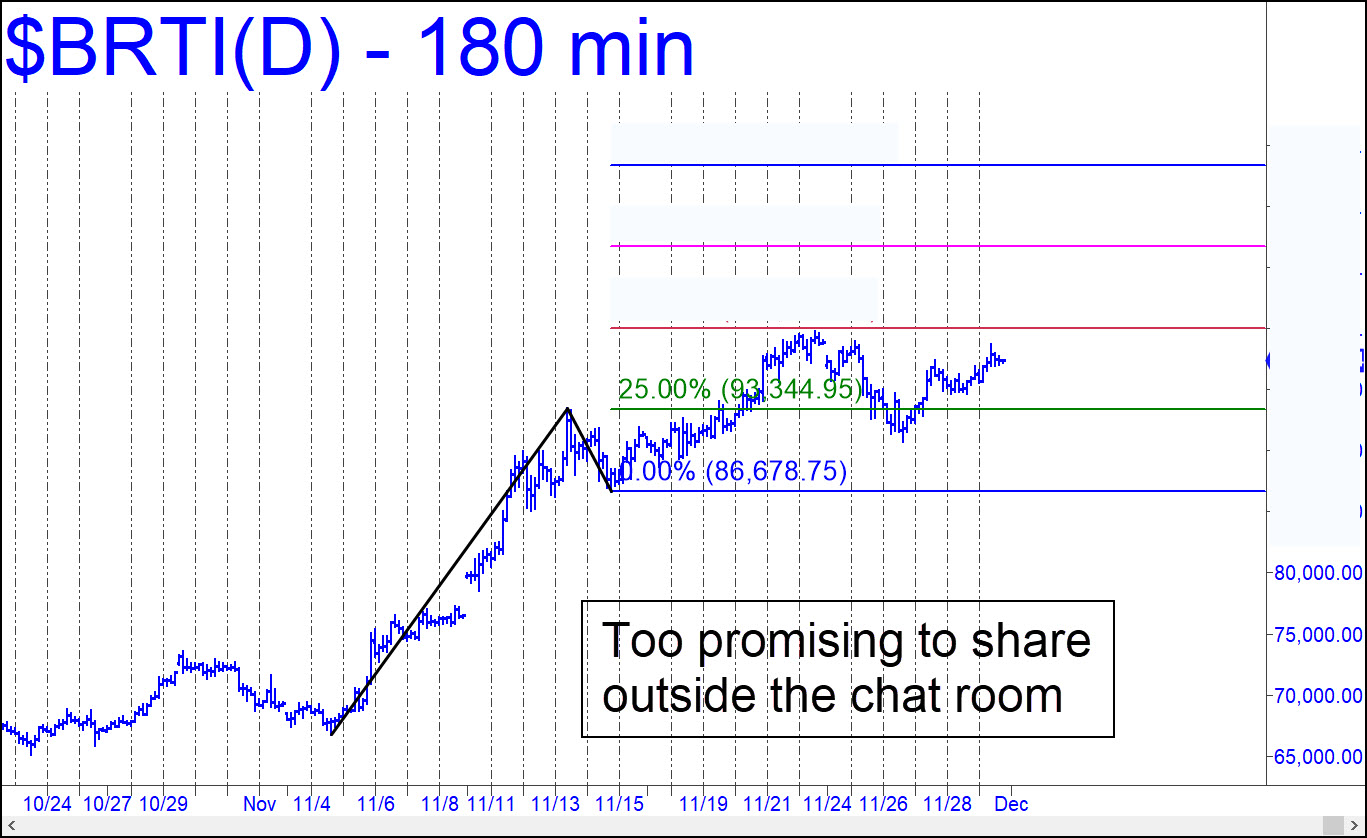
 The chart shown (inset) substitutes a single target for two at, respectively, 107,670 and 119,253 that were given here last week. They will remain viable in theory, but it will be simpler to use a single target that would become a lock-up if and when the Hidden Pivot midpoint resistance is decisively exceeded. I have blanked out the Hidden Pivot levels for p, p2 and D because they looked too useful to share with outsiders. To reproduce the chart with the coordinates and precise levels, combine the visual information in the thumbnail chart with data I posted in the chat room at 2:00 a.m. Sunday morning. _______ UPDATE (Dec 6): If you’re updating the chart, add in a low at 92,091 on Thursday that provided a textbook opportunity to get long ‘mechanically’ at the green line (x=93,344) for a so-far $8500 ride. Meanwhile, the target (1xx,343.54) I posted last Saturday at 2:20 a.m. remains not just valid, but downright enticing.
BRTI – CME Bitcoin Index (Last:100,378)
 Posted on December 1, 2024, 5:11 pm EST
Last Updated December 7, 2024, 2:40 am EST
