
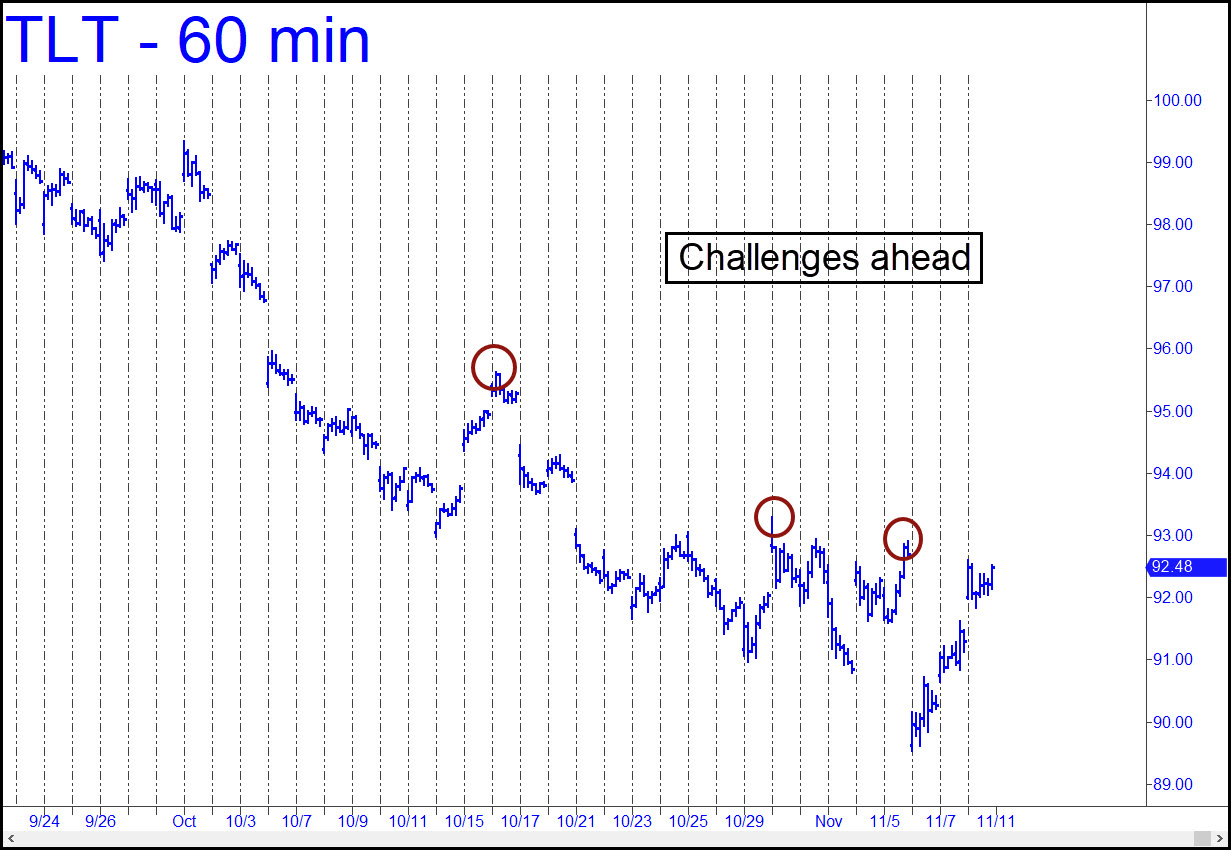
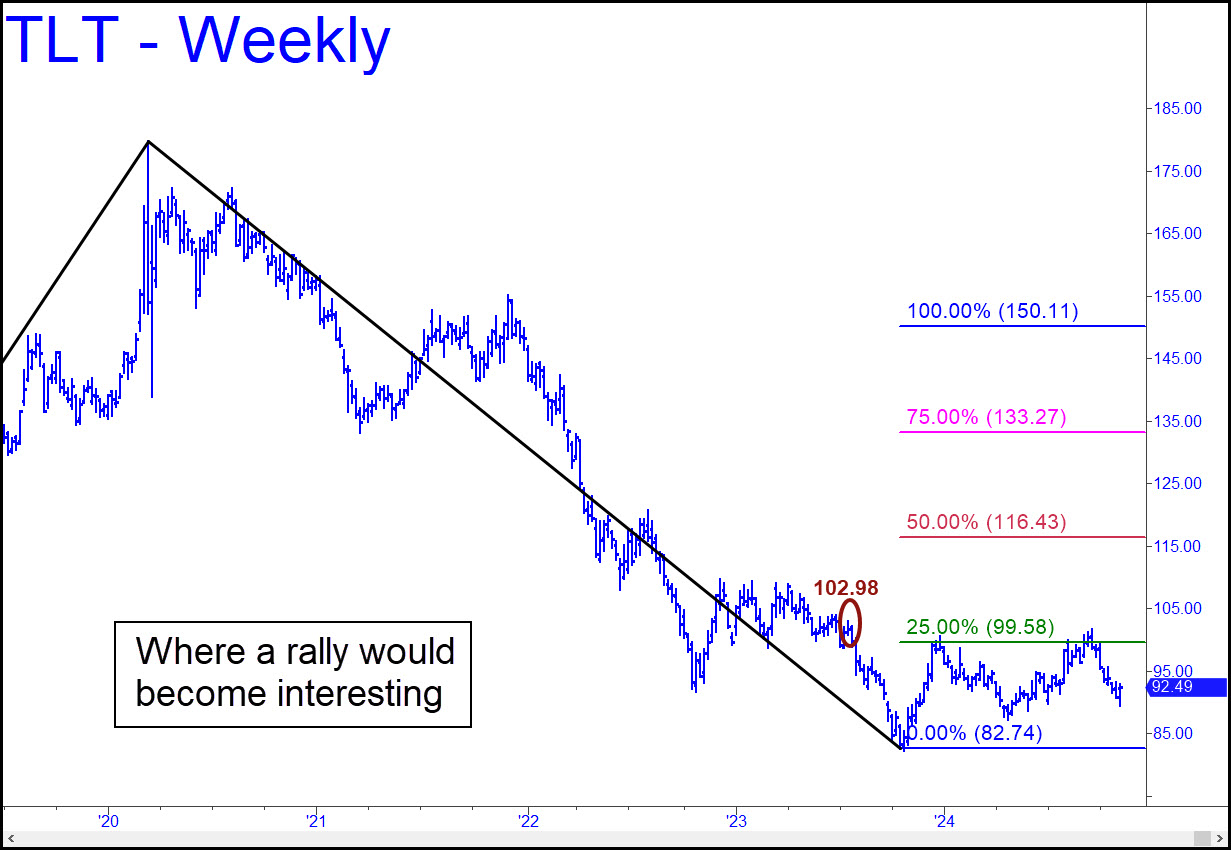
 Last week’s series of gap-up rallies may have seemed impressive, but the move should be regarded as a dead-cat bounce until it starts exceeding ‘external’ peaks such as the ones shown in the chart. So far, it has exceeded no such peaks, even on the lowly hour chart. This means the rally is not even faintly impulsive. If you want a wake-up call to tell you when the uptrend becomes significant, set a screen alert at 102.99. That’s a single tick above the first ‘external’ peak buyers will encounter on the weekly chart. It was recorded in July 2023 and is almost unnoticeable, but it is technically significant. Alternatively, if TLT relapses below 88.42, look for more downside to at least 81.80 and a worst-case low at 75.19.
TLT – Lehman Bond ETF (Last:92.49)
Posted on November 10, 2024, 5:12 pm EST
Last Updated November 8, 2024, 11:32 pm EST