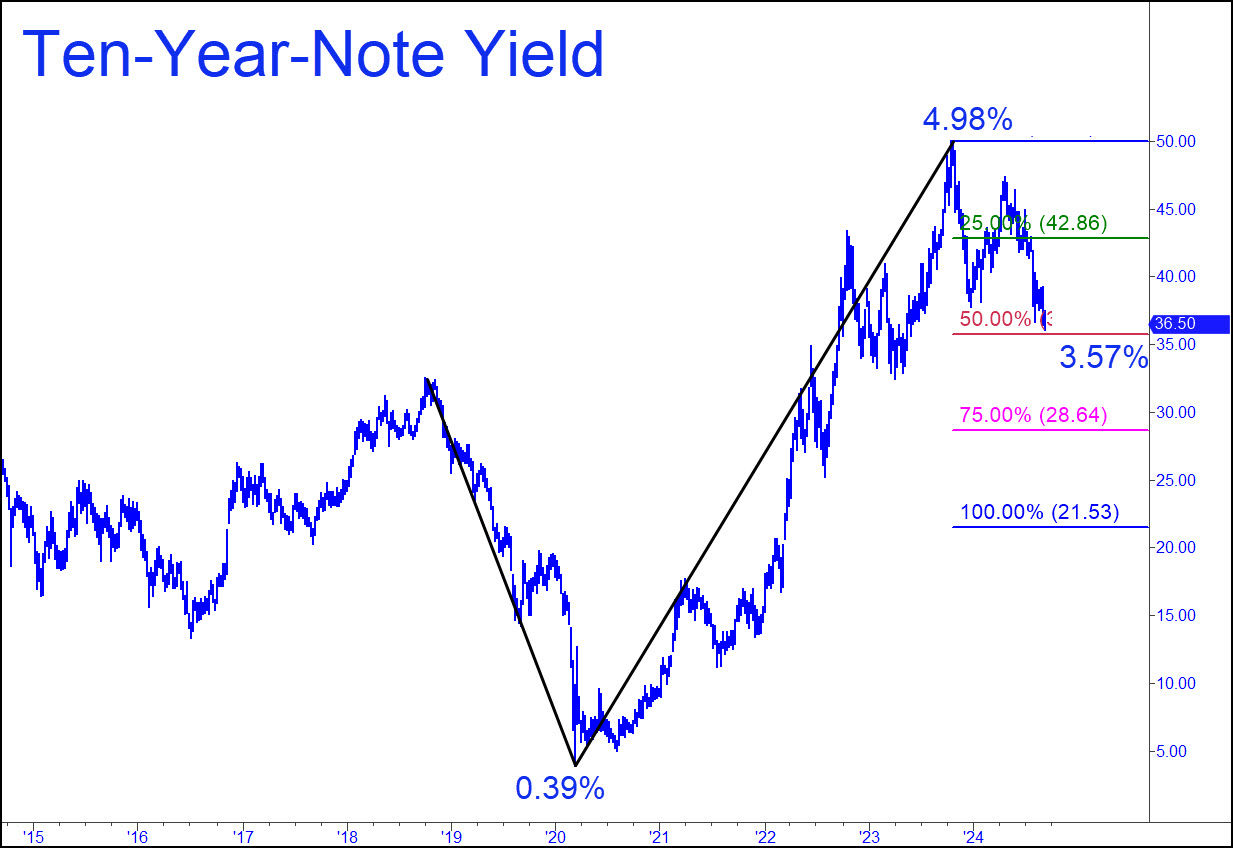
 To the list of trading ‘touts’, I have added yields on the Ten-Year Treasury Note. There seems to be a great deal of uncertainty about where rates for U.S. debt are headed, but this chart should help bring clarity and concision to the forecast. Ten-year rates have fallen from a post-covid high of 4.97% a year ago to a current 3.65%. This is a hair above a crucial midpoint Hidden Pivot support at 3.57% shown in the chart. The ‘reverse’ pattern from which the support was derived is a compelling one that doesn’t care whether the overall look of the chart is ‘toppy’ — i.e., favoring a further fall in rates. We won’t pretend to have a crystal ball, since the support has yet to be tested. But if it were to be decisively exceeded, that would shorten the odds of the 10-year rate falling to as low as 2.15% in 2025-26. It would be congruent with my very bullish outlook for TLT elsewhere on this page. _______UPDATE (Oct 6): Yields signaled a move to higher levels with their recent thrust through the green line (x=3.83%). If they are headed significantly higher, we should see an effortless move past the midpoint resistance at 4.06%. To be sure, there is an alternative ‘a’ low at 37.85 that would raise the midpoint resistance to 4.08%. Let’s watch both levels to determine how strong the rally is, and whether it is fated to die.
TNX.X – Ten-Year Note Rate (Last:3.98%)
 Posted on September 15, 2024, 5:22 pm EDT
Last Updated October 21, 2024, 3:11 pm EDT
