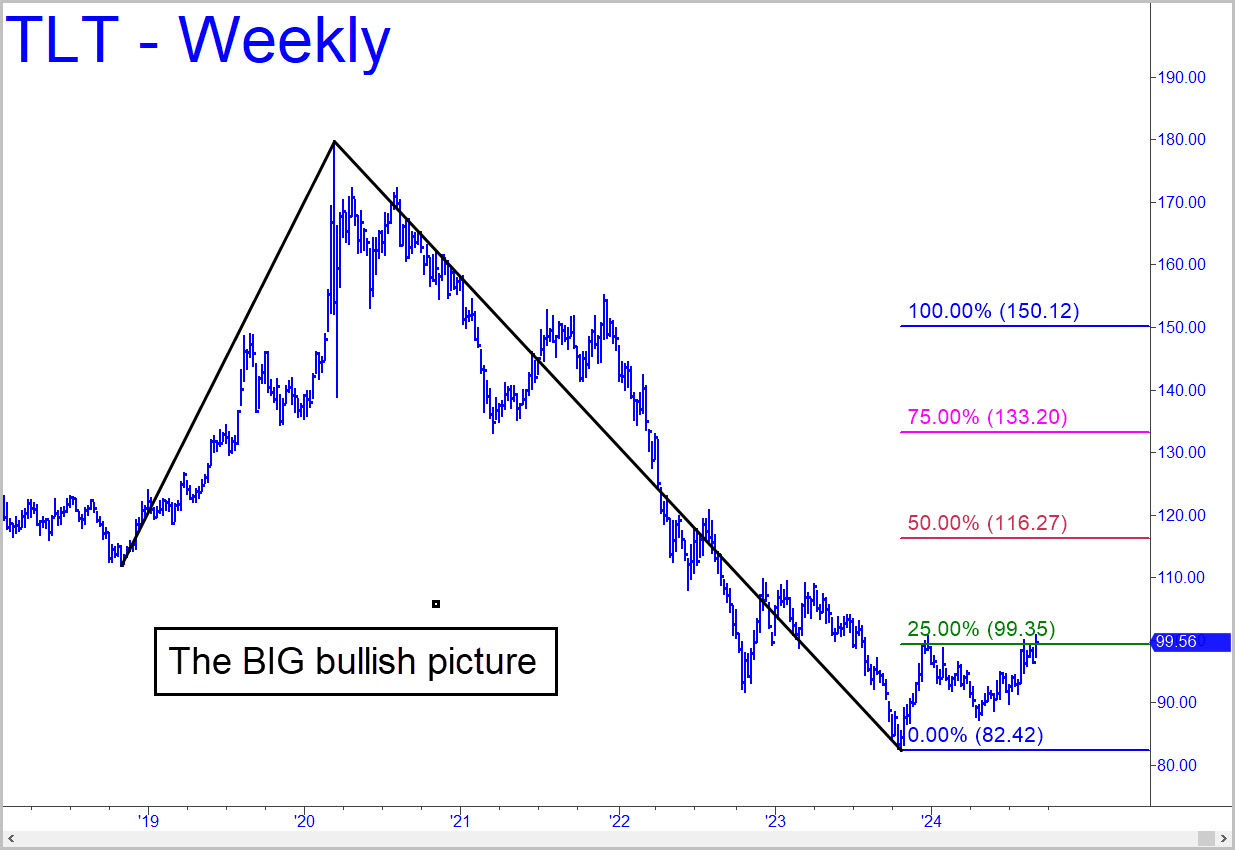
 I presented a daily chart here last week that implies chances of a rally to at least 105.49 are excellent. That would correspond to yields of around 3.64% on the long bond. The weekly chart shown is far more bullish and offers a glimpse of what eventually could unfold in the market for Treasury debt. With a potential move in TLT to 150.12 (!), the projected low on rates would be 2.53%. This seemingly could come about only in the context of a very deep recession or a full-blown depression. There is no predicting what the real rate of return would be, although it seems likely that with asset values deflating, a 2.34% rate would impose a crushing real burden on debtors. More immediately, expect a drop in TLT, and a corresponding rise in rates, after the latter touches 3.84%. That is the midpoint Hidden Pivot support of the pattern projecting 2.53%. _______ UPDATE (Sep 13, 11:31 a.m.): A rally to x=100.57 would trip a compelling ‘mechanical’ short, stop 101.25. The downside target thereupon would be D=98.56.
TLT – Lehman Bond ETF (Last:100.26)
 Posted on September 8, 2024, 5:10 pm EDT
Last Updated September 13, 2024, 11:30 am EDT
