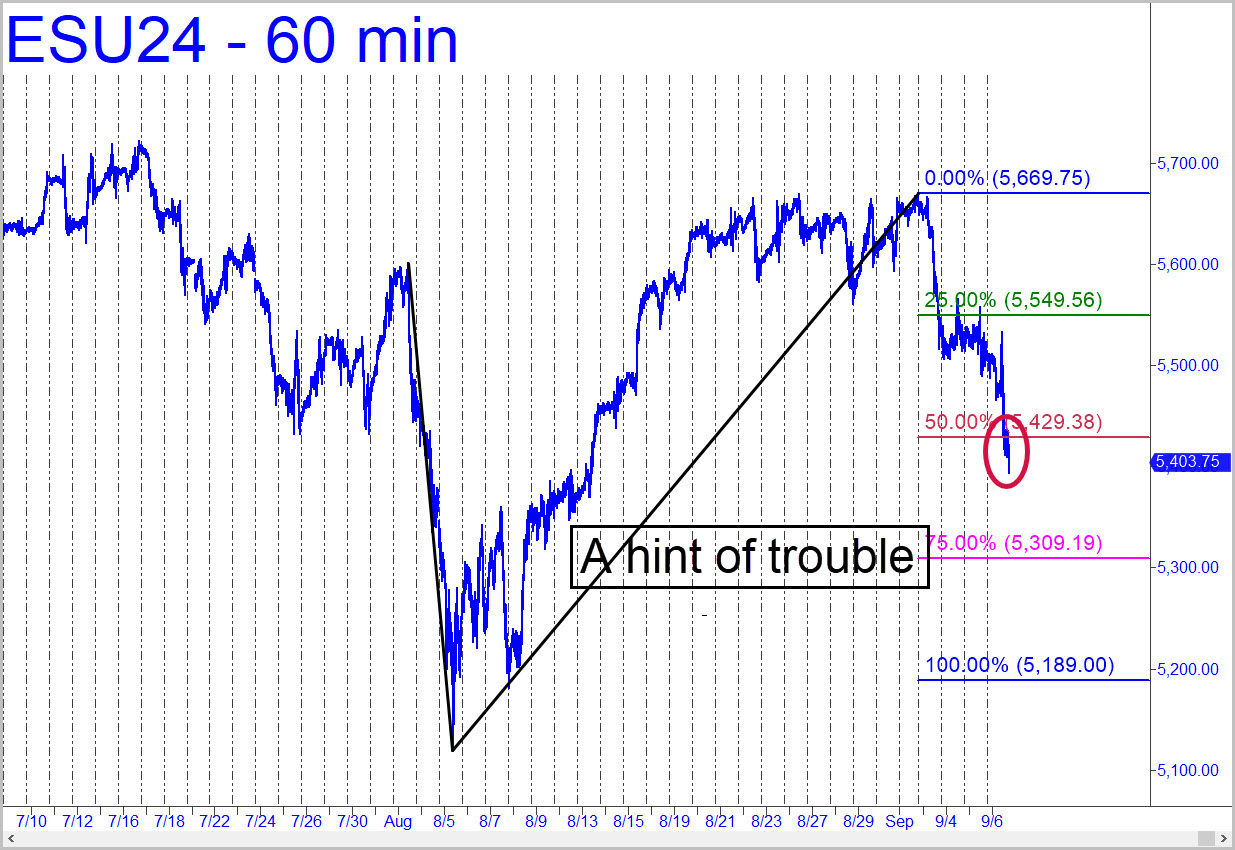
 By midweek, we had reason to expect a 2% drop to at least 5429.38, the midpoint Hidden Pivot support shown in the chart. Unfortunately, the small penetration of this level in the late afternoon on Friday implies more slippage is likely. Now, you can use the magenta line (p2=5309.19) as a minimum downside objective. But be prepared for additional weakness down to as low as d=5189.00, the blue line) if selling snowballs. There is no reason to believe the dropoff from a range of small peaks recorded over the last two weeks will be any worse than that. However, and nevertheless, we should be mindful of a possibility I first broached here months ago — i.e., that because the range of small peaks occurred below mid-July’s record summit, the S&Ps may be replicating the lower highs and lower lows that occurred in the summer of 1929, just ahead of the stock market’s crash in October 1929. Microsoft’s performance will be crucial to the way we view these developments, so be sure to read the latest MSFT ‘tout’ immediately below for more-finely nuanced insights.
ESU24 – Sep E-Mini S&P (Last:5403.75)
 Posted on September 8, 2024, 5:20 pm EDT
Last Updated September 14, 2024, 2:30 pm EDT
