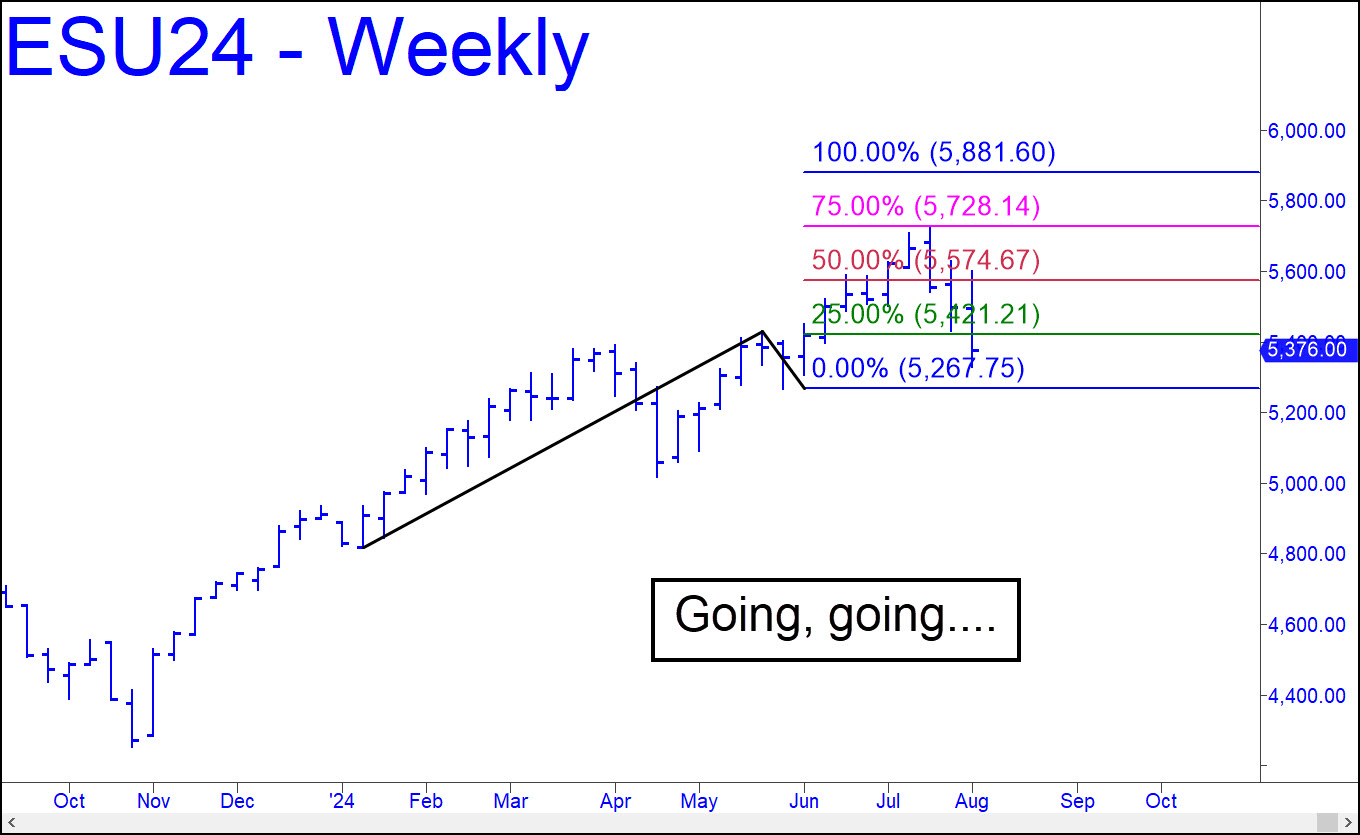
 The selloff begun on July 16 tripped a second ‘mechanical’ buy signal, this time on the weekly chart. The implication is that the September contract will rally to at least p=75564.6without first dipping beneath the pattern’s ‘C’ low at 5267.75. However, there are no guarantees that any rebound will reach the D target at 5881.60, If this holds true, the bull market begun in 2009 would be over. That’s my gut feeling, but we’ll wait to see whether DaBoyz can turn things around with the benefit of a green-line (x) ‘buy’ trigger that they don’t even know exists. In the meantime, you can use a presumably gratuitous feint below ‘C’ to get long, but the theoretical trigger interval of 43-points would require risk-reduction tactics based on a ‘camouflage’ set-up. _______ UPDATE (Aug 6, 10:52 a.m. EDT): The breach of so clear and compelling a target as d=5168.75 offers persuasive evidence that the current, manic bounce is just a bear rally and a distributive fraud. Plan accordingly, and don’t get sucked by whatever Wall Street’s cud-chewing shills spew in the days and weeks ahead.
ESU24 – Sep E-Mini S&P (Last:5318.00)
 Posted on August 4, 2024, 5:20 pm EDT
Last Updated August 6, 2024, 1:51 pm EDT
