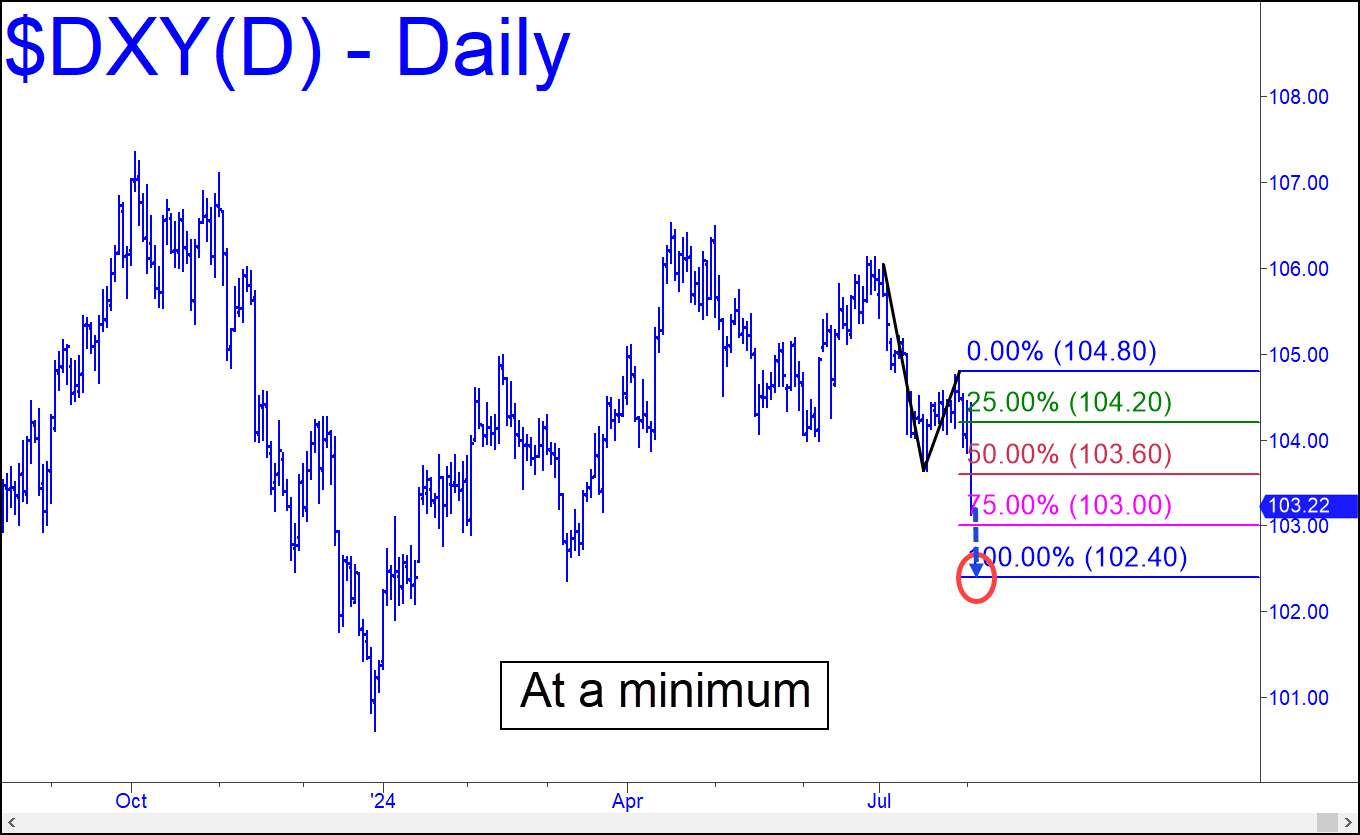
 Friday’s plunge through the red line (p=103.60) means the Dollar Index will fall to at least 102.40 before it can attempt to find traction. That would put it even with an important low recorded last March, but any further slippage, especially if sharp, would be signaling a plunge toward the 100.62 low notched in the final days of 2023. Here’s a longer-term chart, however, that shows a path all the way down to 93.78. That nearly unthinkable target is precisely confirmed by the bounce off p=100.57, and its attainment would become an odds-on bet if DXY closes for two consecutive weeks below p. _______ UPDATE (Aug 9, 2:02 p.m.): The dollar has bounced modestly from 102.16, just 24 cents below the minimum downside target given above. When the rally fails as I expect it to, look for more weakness into the range 99.58-100.57, between two key lows on the daily chart that occurred, respectively, on July 19 and December 28. ______ UPDATE (Aug 16): As anticipated above, the dollar has turned lower yet again, presumably bound for the 99.58-100.57 range noted. If you trade off this vehicle, please note that DXY will have a chance to bounce from exactly 101.26, a Hidden Pivot derived from the 240-minute chart, where A= 104.45 on 8/1.
DXY – NYBOT Dollar Index (Last:102.40)
 Posted on August 4, 2024, 5:21 pm EDT
Last Updated August 16, 2024, 8:29 pm EDT
