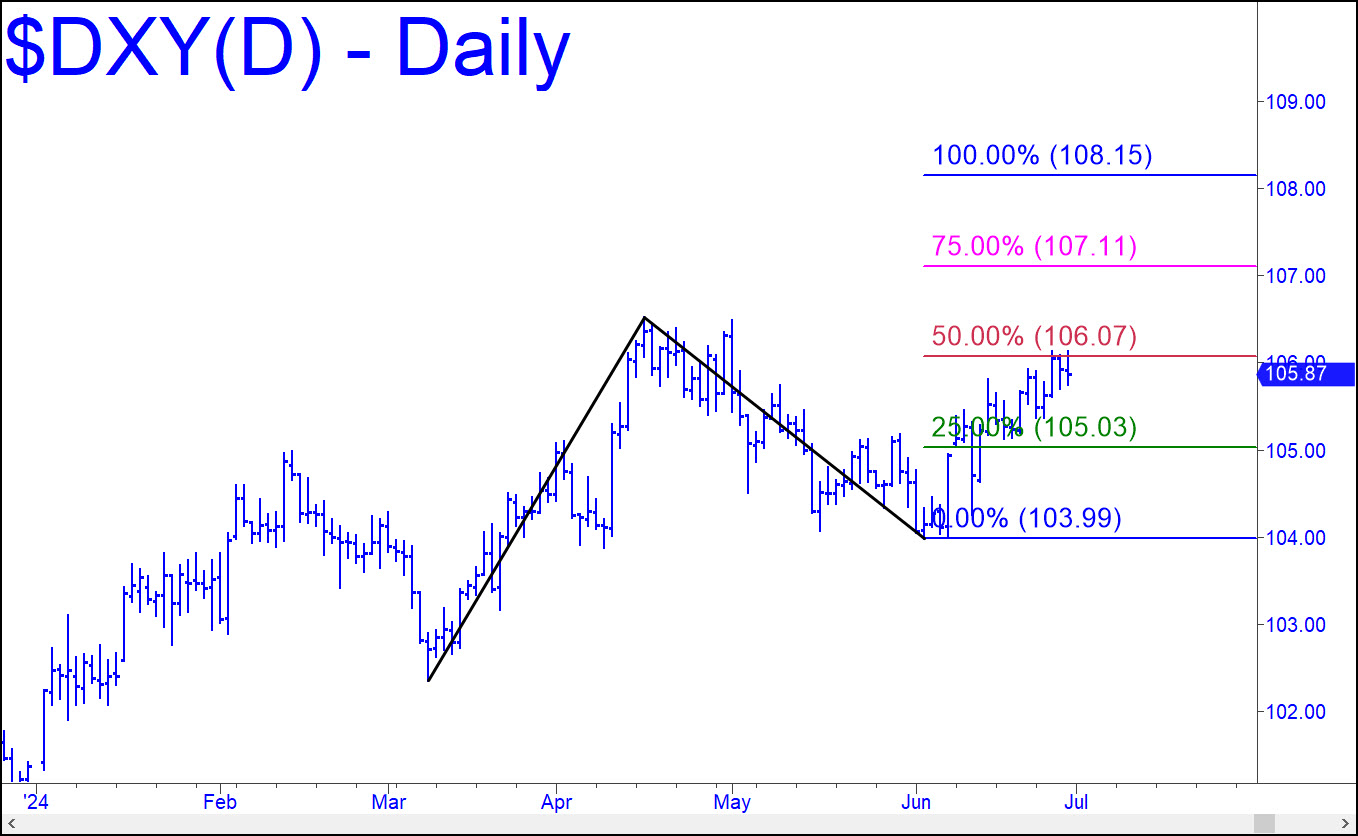
 Although this week’s commentary discusses why the dollar’s weekly chart looks interesting, the daily chart shown is equally interesting in another way. DXY spent most of the week stalled precisely at the 106.07 midpoint Hidden Pivot resistance of a bullish pattern that projects to as high as 108.15. The way in which buyers handle this obstacle cannot but accurately predict the dollar’s course over the next several weeks. In any event, and however unlikely, a swoon to the green line (x=105.03) would trigger an enticing ‘mechanical’ buy.
DXY – NYBOT Dollar Index (Last:105.87)
 Posted on June 30, 2024, 5:10 pm EDT
Last Updated June 29, 2024, 10:59 pm EDT
