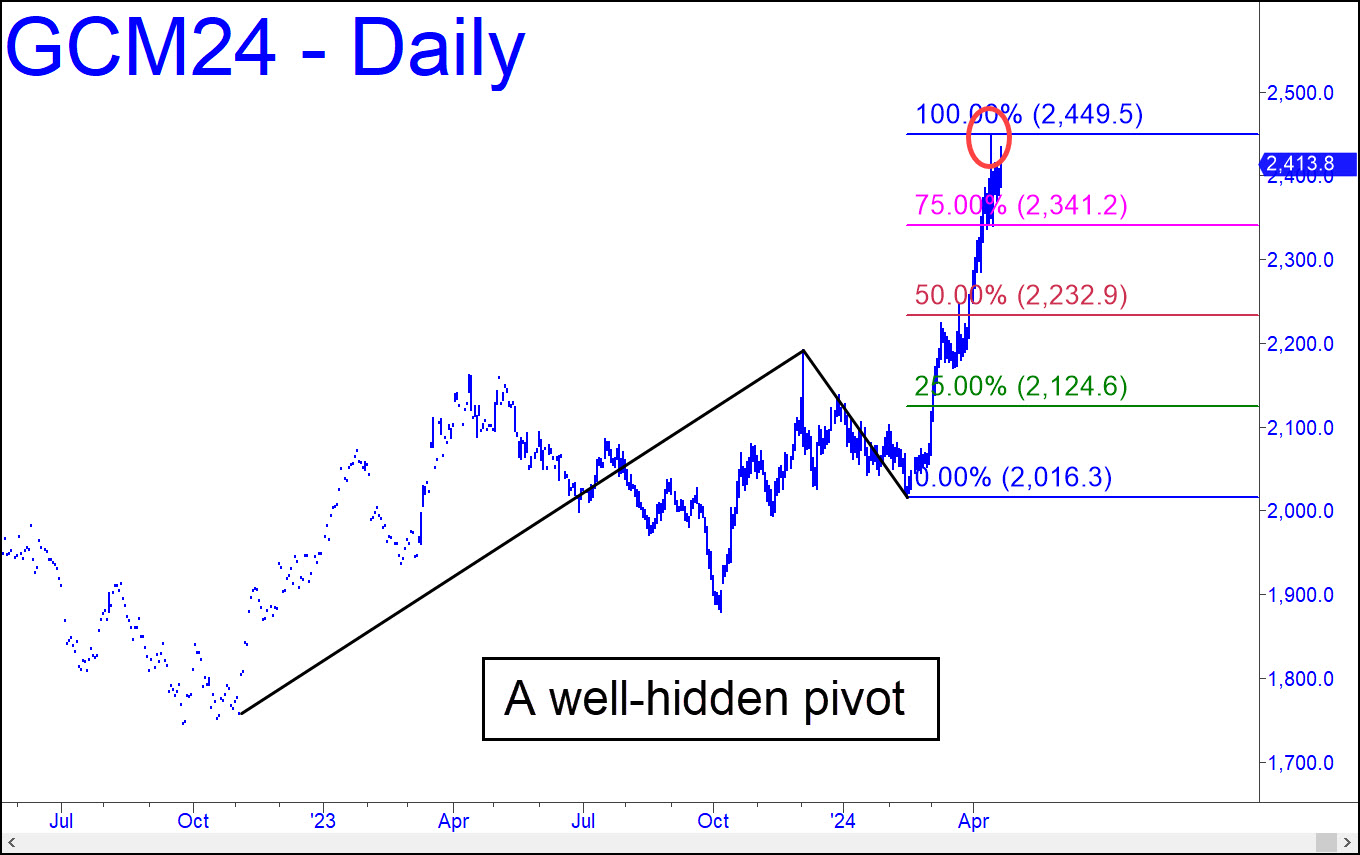
 I only belatedly discovered the reason for the hard selloff a week ago from 2448.80. That number lies just 0.70 from the target of the very gnarly pattern shown. I still think the June contract has a better than 50% chance of achieving a somewhat higher target at 2514.60 given here earlier. However, we should be very cautious at the moment, since this corrective pattern on the weekly chart suggests the June contract will fall to at least 2309.50 before it finds traction. Worst case would be 2170.20, and we cannot rule it out, but we’ll be looking to bottom-fish at p=2309.50 (slightly adjusted from last week) in any case. _______ UPDATE (Apr 23, 1:35 a.m.): The clowns/thieves/Masters of the Universe who erroneously believe they are manipulating this vehicle were themselves manipulated into a nearly $40 plunge when June Gold fell Monday night to a so-far low at 2308.70 — less than $1 from the Hidden Pivot target I’d flagged above. The $19 bounce that has occurred so far would need to hit 2348.00 to move the futures out of the danger zone; otherwise, look for a further drop to at least 2239.90 (see my chart), a Hidden Pivot support that can be bottom-fished as aggressively as the one at 2309.50.
GCM24 – June Gold (Last:2324.90)
 Posted on April 21, 2024, 5:12 pm EDT
Last Updated April 23, 2024, 1:41 am EDT
