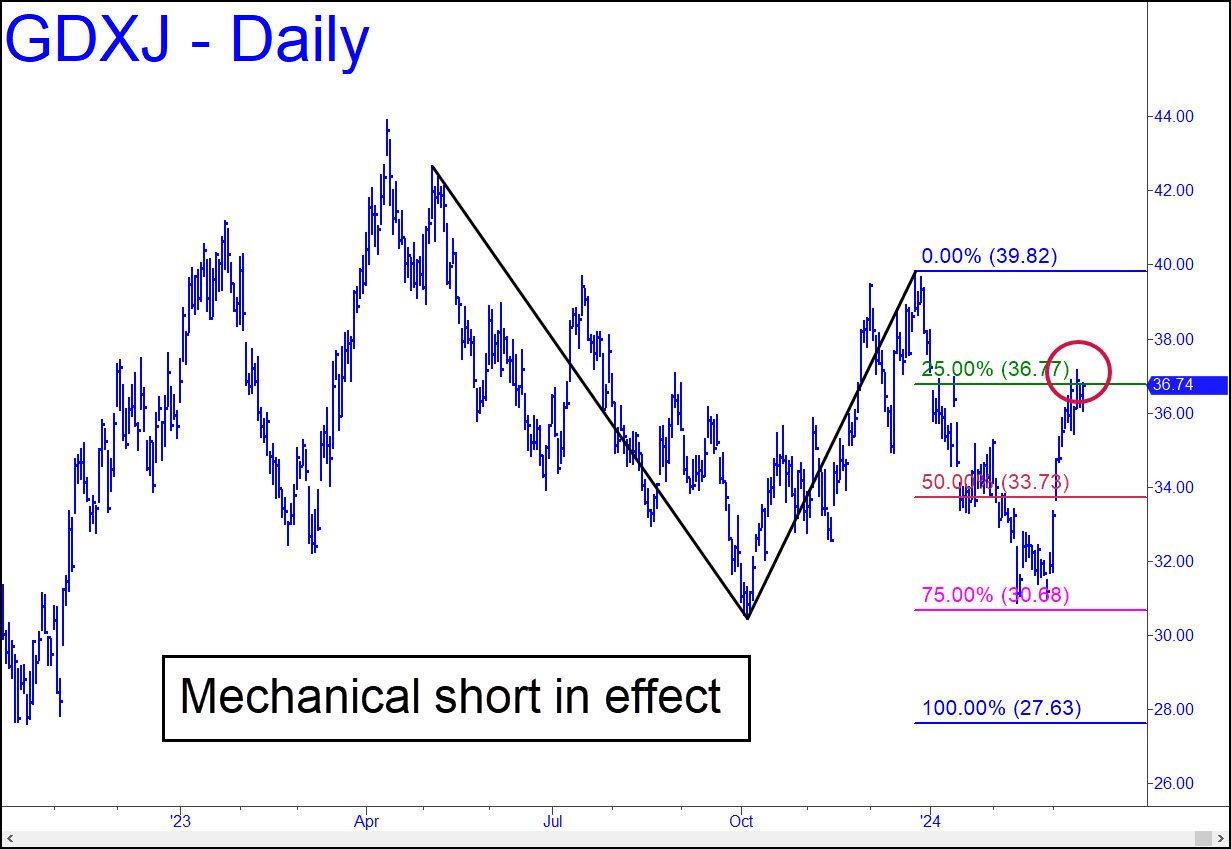
 Although the impulse leg in the conventional pattern shown was not very powerful, it was persistent enough that I’ll give the bearish interpretation of this chart the benefit of the doubt. That means that GDXJ is on a ‘mechanical’-short signal triggered on first contact with the green line. That implies that GDXJ is more likely to fall to p=33.73 than continue its ascent toward C=39.82. Regardless, I doubt that sellers will be able to push it down to D=27.63. _______ UPDATE (Mar 20, 5:52 p.m.): Use the 42.10 target of this large reverse pattern as a minimum upside projection for now. _______ UPDATE (Mar 21, 10:46 a.m.): I’ve flagged the 38.15 target of this reverse pattern on the weekly chart as a significant impediment and potential rally-stopper. It’s worth shorting for a scalp, but my gut feeling is that it will give way, allowing further progress to the 42.10 target noted above.
GDXJ – Junior Gold Miner ETF (Last:37.04)
 Posted on March 17, 2024, 5:13 pm EDT
Last Updated March 21, 2024, 10:50 am EDT
