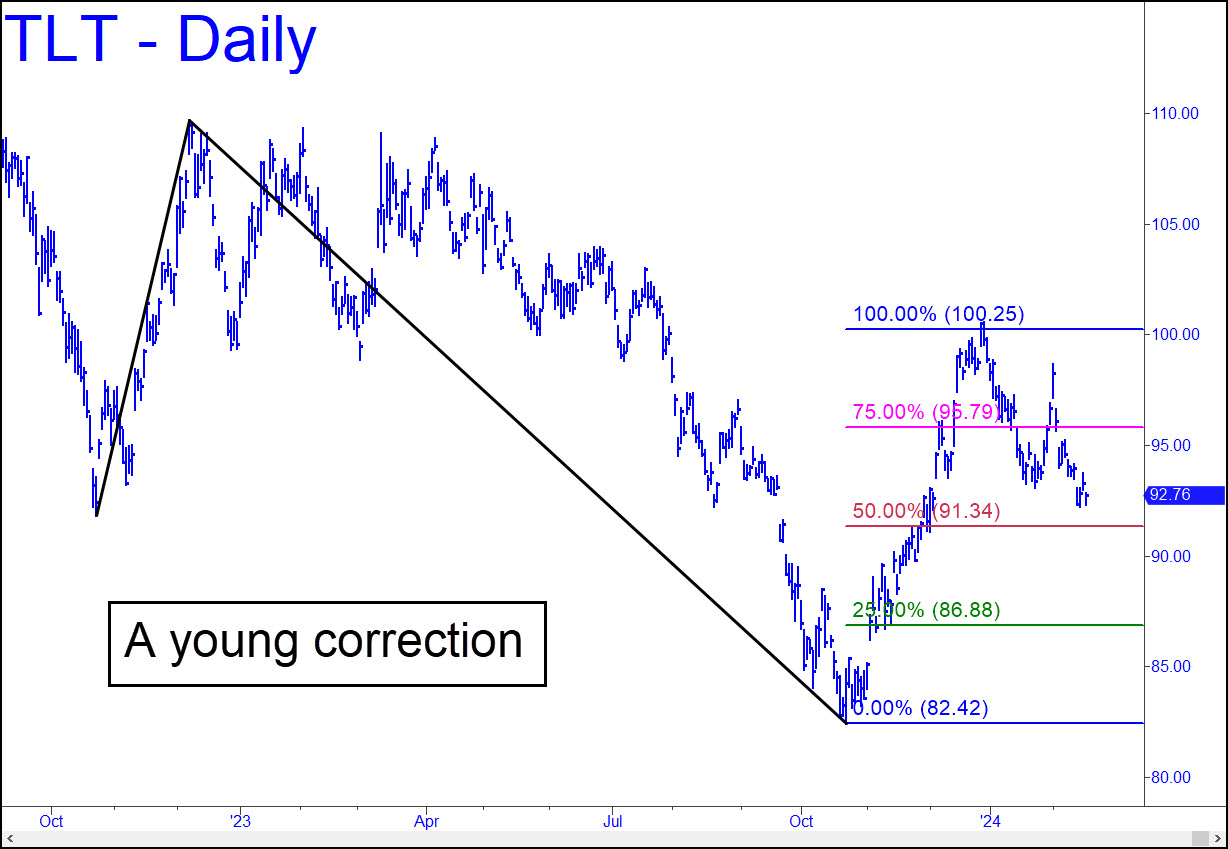
 It took TLT more than a year to achieve the 100.25 target of the reverse pattern shown, and so the three-week-long correction that has occurred so far should be viewed as an early phase of whatever retracement is coming. That doesn’t preclude the possibility of a reversal at any time, even in the next week or two, that would take this T-Bond ETF to new recovery highs. Most immediately, though, technical signs suggest the correction will come down to 91.20, and that is where we should look for signs that the worst is over. Probably not, but as always, we’ll let the price action speak for itself. _______ UPDATE (Feb 23): Friday’s strong rally derailed what had looked like an unavoidable descent to the 91.20 target noted above. The bounce, if that’s what it is, should carry to at least p=94.94. Even at 96.80, however, the thrust would still offer a promising opportunity to get short ‘mechanically’ for a one-level ride south, at least.
TLT – Lehman Bond ETF (Last:93.87)
 Posted on February 18, 2024, 5:12 pm EST
Last Updated February 23, 2024, 8:37 pm EST
