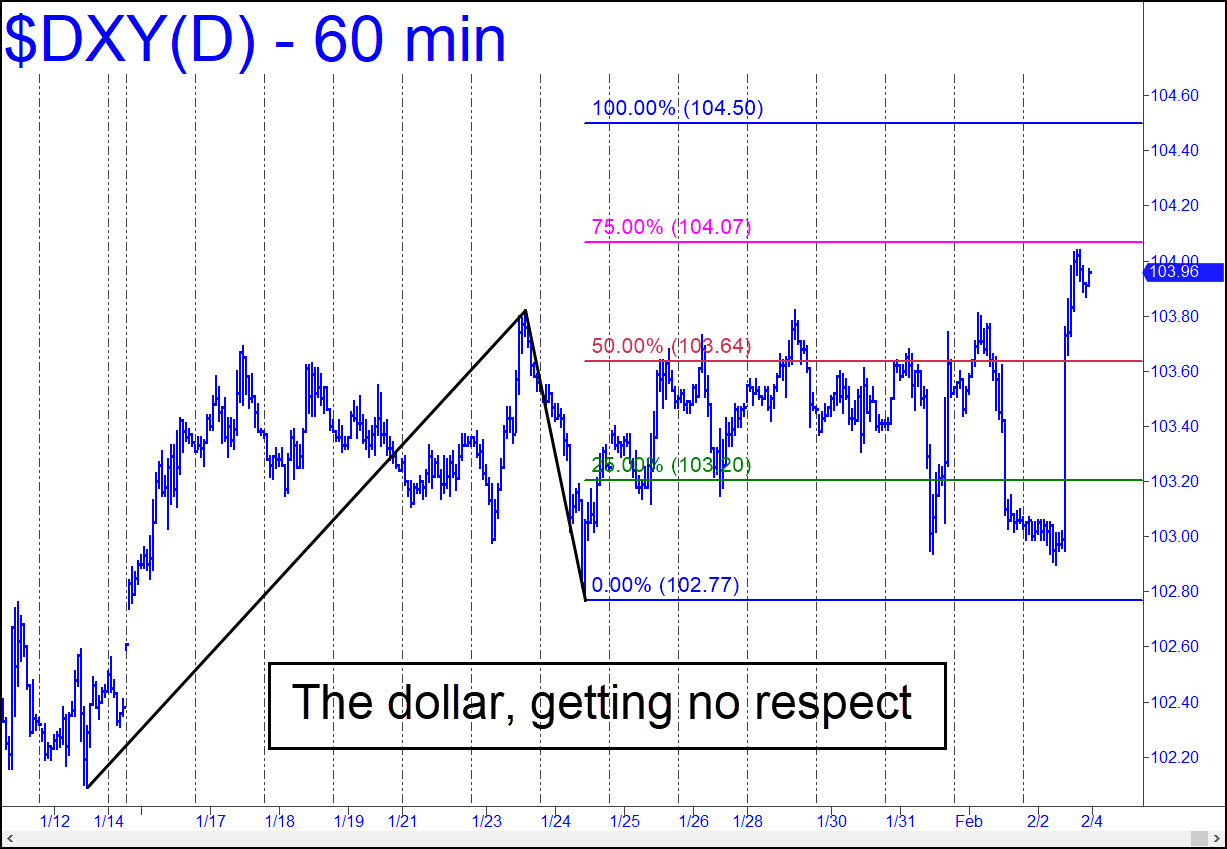
 For the deepest, most liquid trading vehicle on earth, the dollar has been getting precious little respect. The chart shows how it has been buffeted around, getting sand kicked in its face by the BRICs, Davos, Iran and who-know-who else. All that aside, the pattern shown has sufficient clarity to tell use whether DXY will remain a 98-pound weakling for yet a while longer, or instead embark on a recovery tour to the 108.38 target of this pattern. If so, a crucial test awaits at 104.50, which is a double resistance, the respective p and D Hidden Pivots of the two charts featured in this tout. _______ UPDATE (Feb 6, 1:05 p.m.): Rallies yesterday and today created two peaks that exceeded the double Hidden Pivot resistance by just a dime. My hunch is that the overshoot, tiny as it was, will suffice to keep the uptrend alive. However, we’ll need to see how strong the minor abcd corrective patterns are before we can judge more confidently whether a significant rally is under way. Whatever the case, it would become a ‘mechanical’ buy on a pullback to x=102.56.
DXY – NYBOT Dollar Index (Last:104.22)
 Posted on February 4, 2024, 5:16 pm EST
Last Updated February 11, 2024, 7:47 pm EST
- February 5, 2024, 4:08 pm
-
February 5, 2024, 12:31 pm
The $ just made a new recovery High @ 104.60 ; a pleasure to see. Time will reveal the strength of this move
and the benefit from a stronger $.
Thanks, Dean

Earlier today I noted that the $ had touched 104.60 – a breakthrough.
( that data from my phone and it still says the same. )
Just now I noticed on Barchart & FINVIZ that 104.465 was the high.
I did not know that there could exist such disparity- my apologies.
As usuaal, let the buyer beware!
Respectfully, Dean Ezell