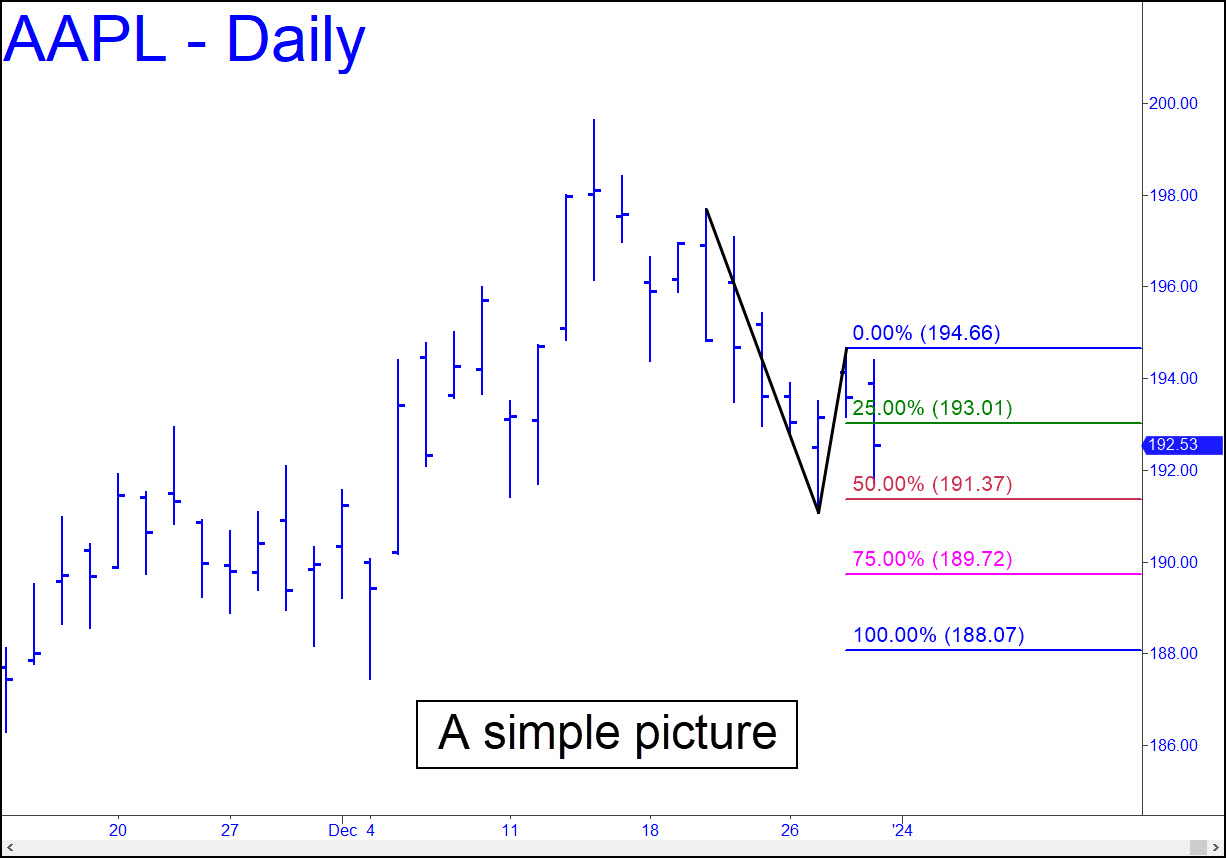
 There are numerous conflicting currents acting on AAPL at the moment, but I’ve settled on a corrective pattern on the daily chart that seems clear enough to rely on in the days ahead. A bounce precisely from p=191.37 would help us get oriented, but any decisive breach of this support either intraday or on a closing basis would portend more slippage to as low as D=188.07. We’ll be entering a new year, an event that should have no particular impact on stocks but which often has ignited powerful rallies. In any case, the pattern shown should be easily tradable in all the usual ways, since it began with a ‘textbook’ impulse leg. _______ UPDATE (Jan 2, 12:15 p.m.): This morning’s take-no-prisoners opening shredded every minor ‘D’ target/support on the hourly chart, generating an impulse leg in the process. This implies that any rally that falls short last year’s high at 200 is setting up another leg down.
AAPL – Apple Computer (Last:186.70)
 Posted on December 31, 2023, 5:19 pm EST
Last Updated January 2, 2024, 12:14 pm EST
