
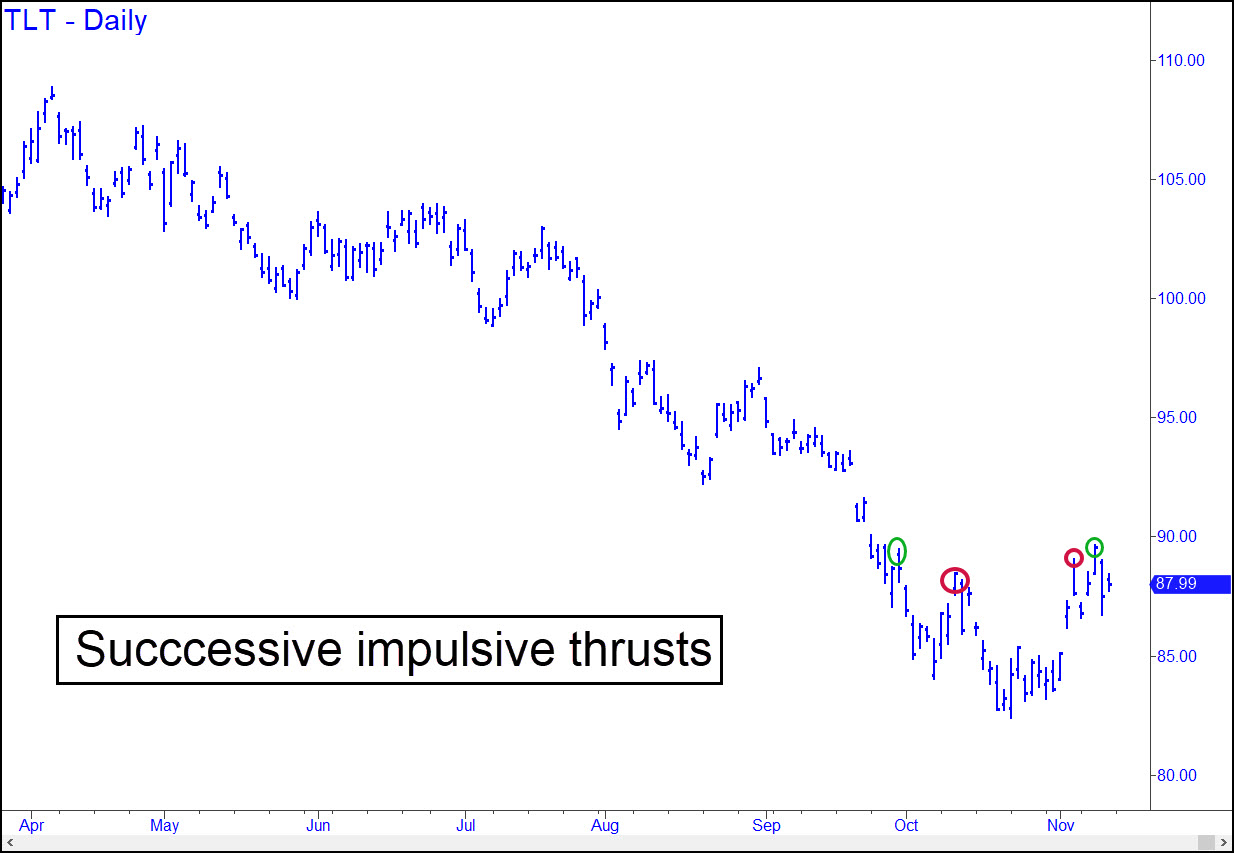
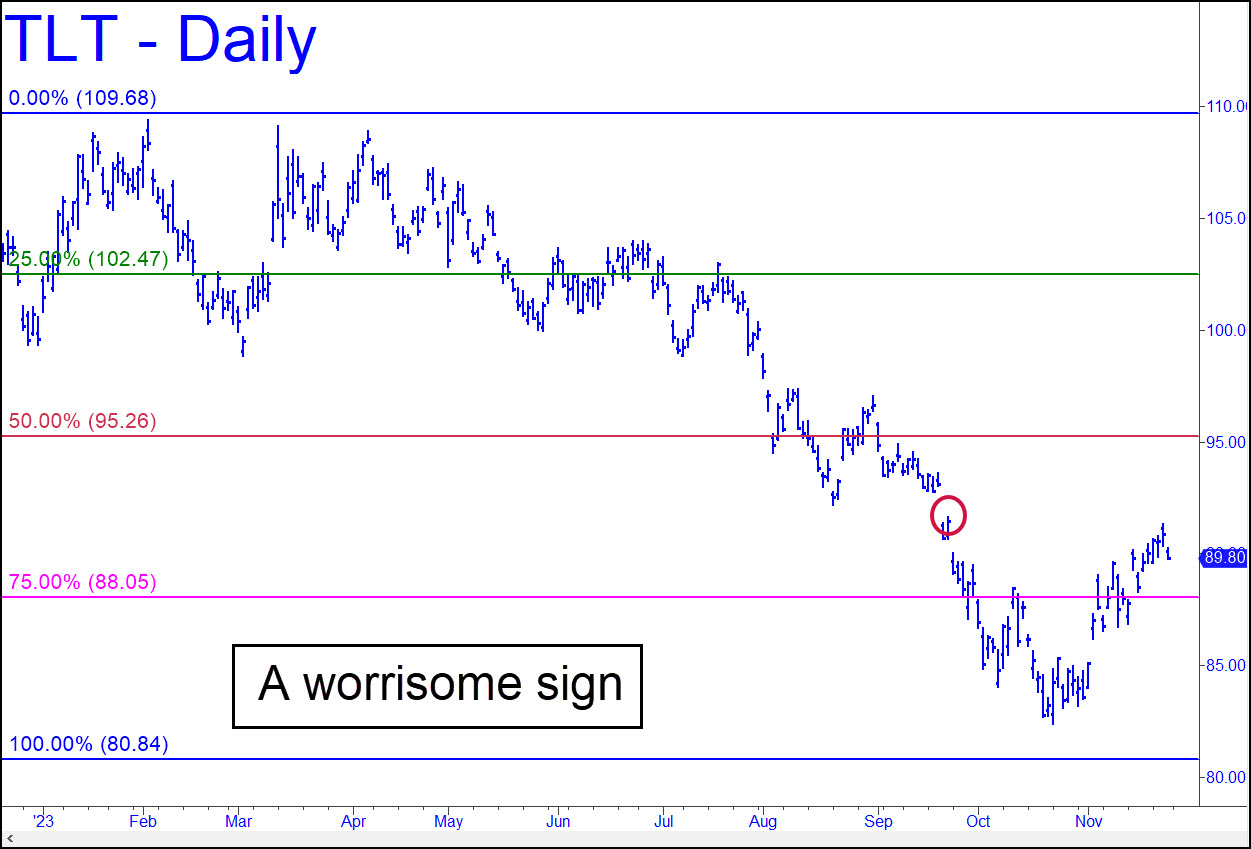
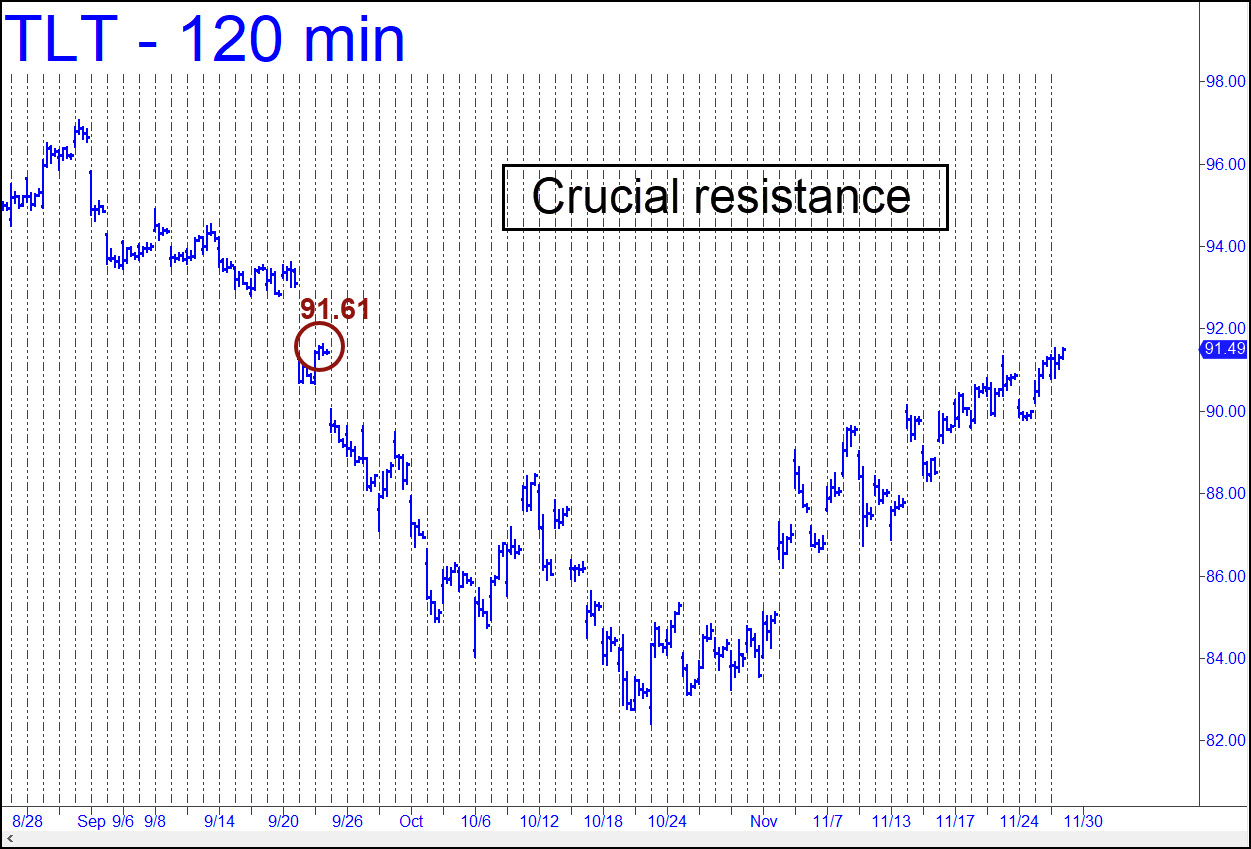
 Each new thrust has been impulsive, surpassing two prior peaks as required by our rules. This is a reliable sign that the bull move begun from 82.42 three weeks ago is healthy and not losing strength. The next leg up will be more challenging, however, since the nearest peak needing to be surpassed lies well above, at 96.54. Buyers will be well fortified for the task, however, given their demonstrated ability to handle lesser peaks with ease. ______ UPDATE (Nov 24): No sooner do I tout the bullishness of TLT’s easy move through prior peaks than it narrowly fails to exceed a small but daunting one at 91.61 recorded on September 22. This is not necessarily the death knell for the impressive bull move from October 23’s 82.77 low, but the apparent change of heart warrants close monitoring. The selling would need to hit 86,73 to generate a bearish impulse leg of daily-chart degree, probably killing the nascent bull. _______ UPDATE (Nov 28, 4:54): The small but technically significant ‘look-to-the-left’ peak at 91.61 shown in this chart is crucial to the intermediate-term picture. TLT looks ready to hurdle it, which would imply more upside over the next several weeks to as high as the 97.05 peak recorded in late August
TLT – Lehman Bond ETF (Last:89.80)
Posted on November 12, 2023, 5:10 pm EST
Last Updated November 28, 2023, 4:53 pm EST