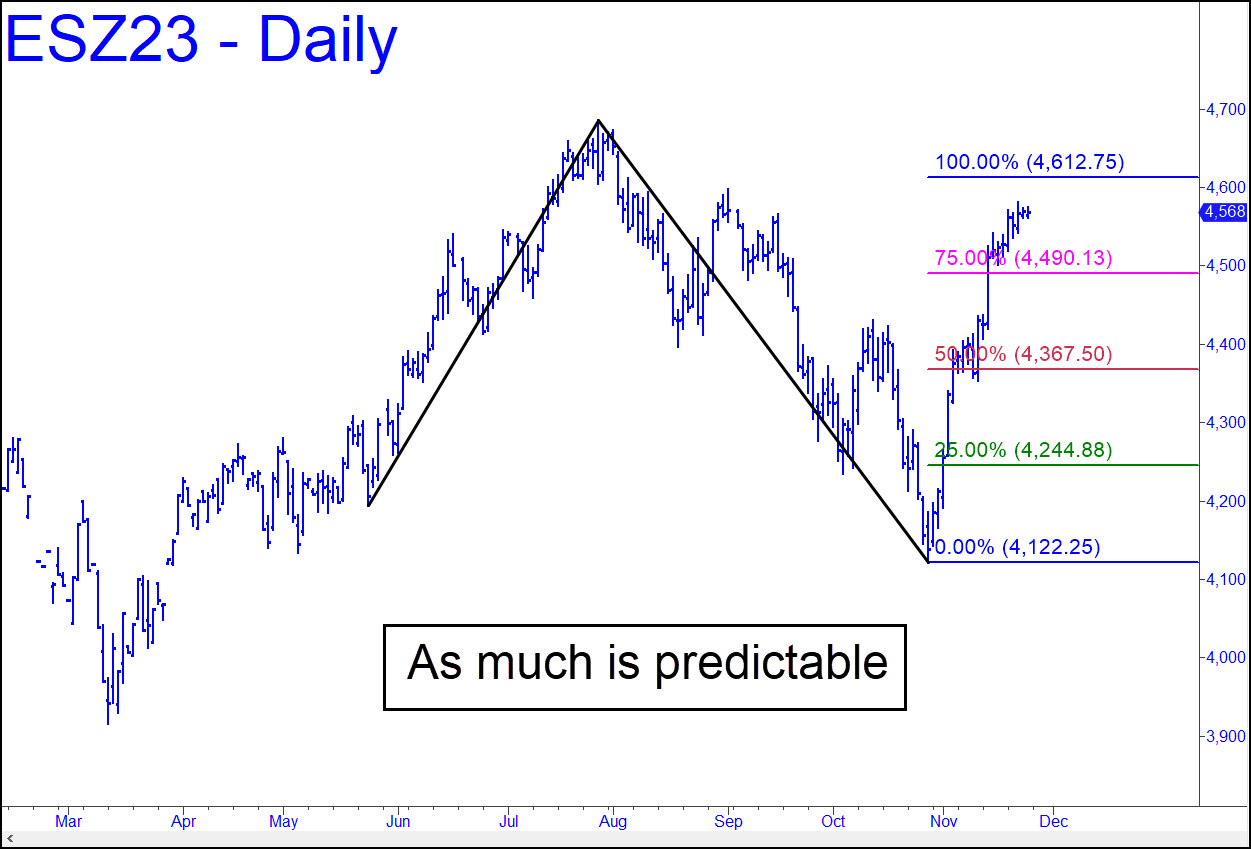
 The December contract is about to get interesting, since its steep climb to a 4612.75 target, the attainment of which was never in doubt, will soon generate a powerful new impulse leg. This will happen when the uptrend exceeds the 4597.50 ‘external’ peak recorded on September 1. Although the relatively small push it would take to achieve new record highs never figured into our trading plans, it was always a possibility. If and when it happens, we’ll want to keep this old IBM chart well in mind, since it is as perfect an example as I could offer to show you how devious a major top can be. This one trapped bulls and bears alike with an initial high that fell slightly shy of my D target. When the stock sold off from the initial high, bears evidently were so busy patting themselves on the back that they were unprepared for, and unbelieving of, the short-squeeze sneak attack that produced the final high exactly at D. The devastating collapse that occurred thereafter could only have happened if everyone were unprepared for it. I’ve left some additional notes on the chart, which was designed to teach a key aspect of the Hidden Pivot Method, to wit: Healthy trends produce ‘abcd’ corrections that do not reach their ‘d’ targets. This one did, however, thereby warning that when IBM reached D of the dominant (i.e., bull-market) cycle, that would be the last hurrah of the long-term bull.
ESZ23 – Dec E-Mini S&Ps (Last:4568.25)
 Posted on November 26, 2023, 5:22 pm EST
Last Updated November 28, 2023, 5:16 pm EST
