
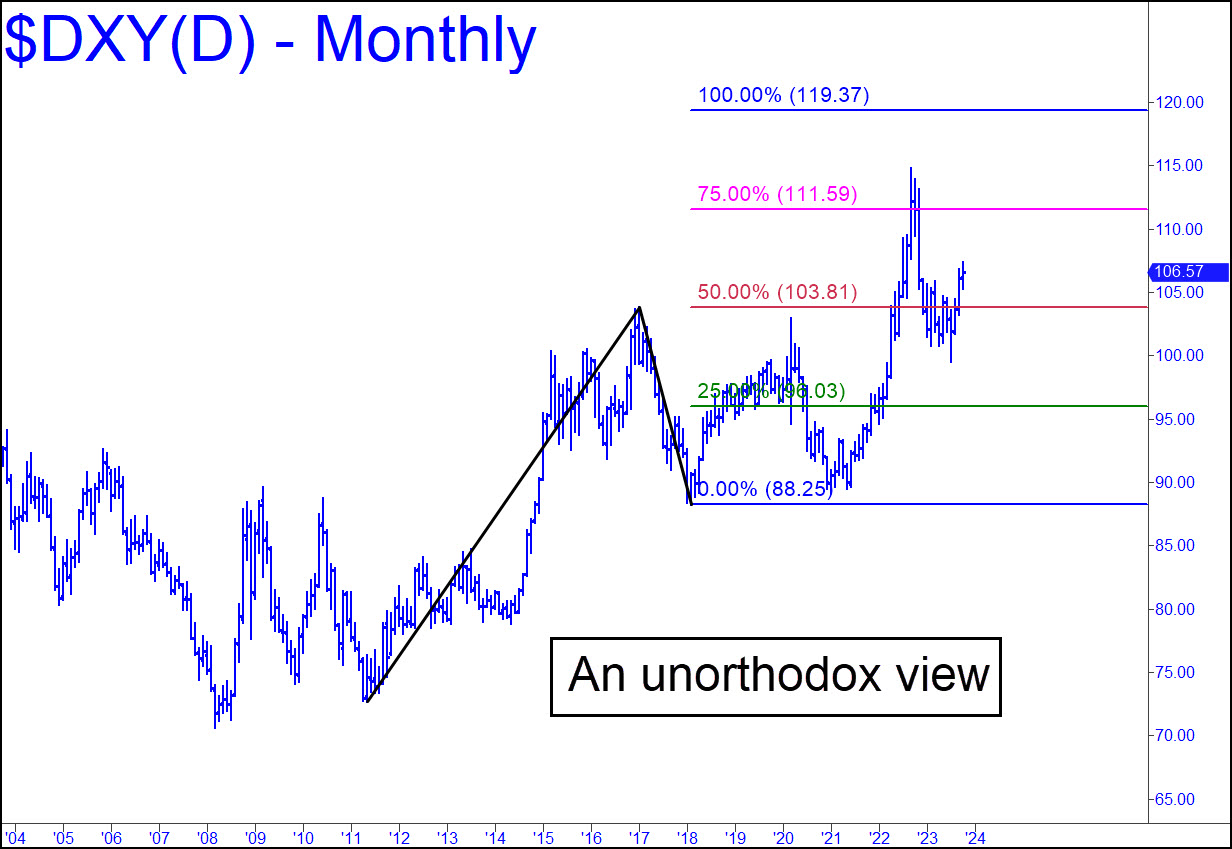
 The monthly chart shown offers an unorthodox view that should be held in mind as the dollar makes its way higher. Much higher. Last week I presented a weekly chart that went back to 2019 with a 124.72 target. This one stretches back to 2004 and has a somewhat less ambitious ‘D’ target at 119.37. I’ll suggest sticking with the earlier version to get a precise handle on trend strength in the weeks ahead. Specifically, you should use its 112.16 midpoint resistance as a minimum upside projection for the next six to eight weeks. However, in the highly unlikely event of a vicious swoon to the green line of this monthly chart (x= 96.03) , you’ll be able to recognize it for what it is: just a correction.
DXY – NYBOT Dollar Index (Last:106.57)
Posted on October 29, 2023, 5:15 pm EDT
Last Updated October 27, 2023, 11:38 pm EDT