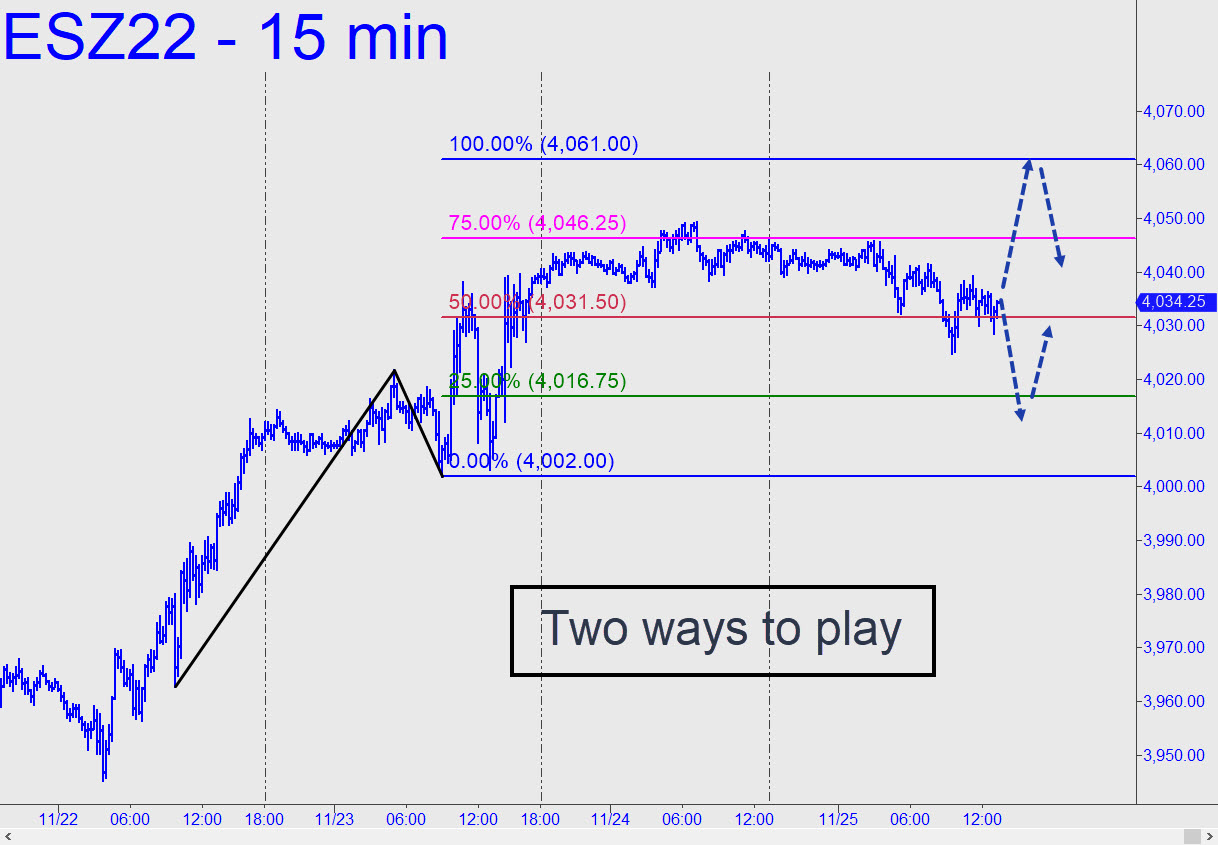
 The off-kilter pattern shown, with a weak A-B segment that obscures the chart’s ‘mechanical’ appeal, yields a picture that could provide two trading opportunities as the new week begins : 1) a ‘mechanical’ buy at the green line (x=4016.75), stop 4001.75; or, 2) a short at D=4061.00 with a stop-loss as tight as 1.50 points. The first looks more appealing but would require a ‘camouflage’ set-up on a chart of lesser degree to shrink the implied entry risk of $750 per contract. _______ UPDATE (Nov 28, 9:46 p.m.): So much for bottom-fishing at 4016.75, a trade done in by a Sunday night air pocket that turned out to be honest-to-goodness selling. Going forward, use this corrective ‘reverse’ pattern, to gauge trend strength and trade, since it has profitability going for it, even if achieved under duress. A decisive breach of the red line (p=3938.75) would telegraph more downside top2=3882.94, or even D=3827.00, a Hidden Pivot support that can be bottom-fished with the tightest stop-loss you can craft. _______ UPDATE (Nov 30, 6:52 p.m.): Stocks screamed higher, not because of bullish buying, but because no seller would dare get in the way when the Fed is talking its book. That’s how bear rallies work, instantly adding hundreds of billions of ‘dollars’ to the financial economy without requiring any effort or even bulls to do the lifting. This short-covering binge is bound for at least 4214.00 — a near-certainty given the way it vaporized the 4064 midpoint Hidden Pivot resistance.
ESZ22 – Dec E-Mini S&Ps (Last:4092.00)
 Posted on November 27, 2022, 5:20 pm EST
Last Updated November 30, 2022, 6:53 pm EST
