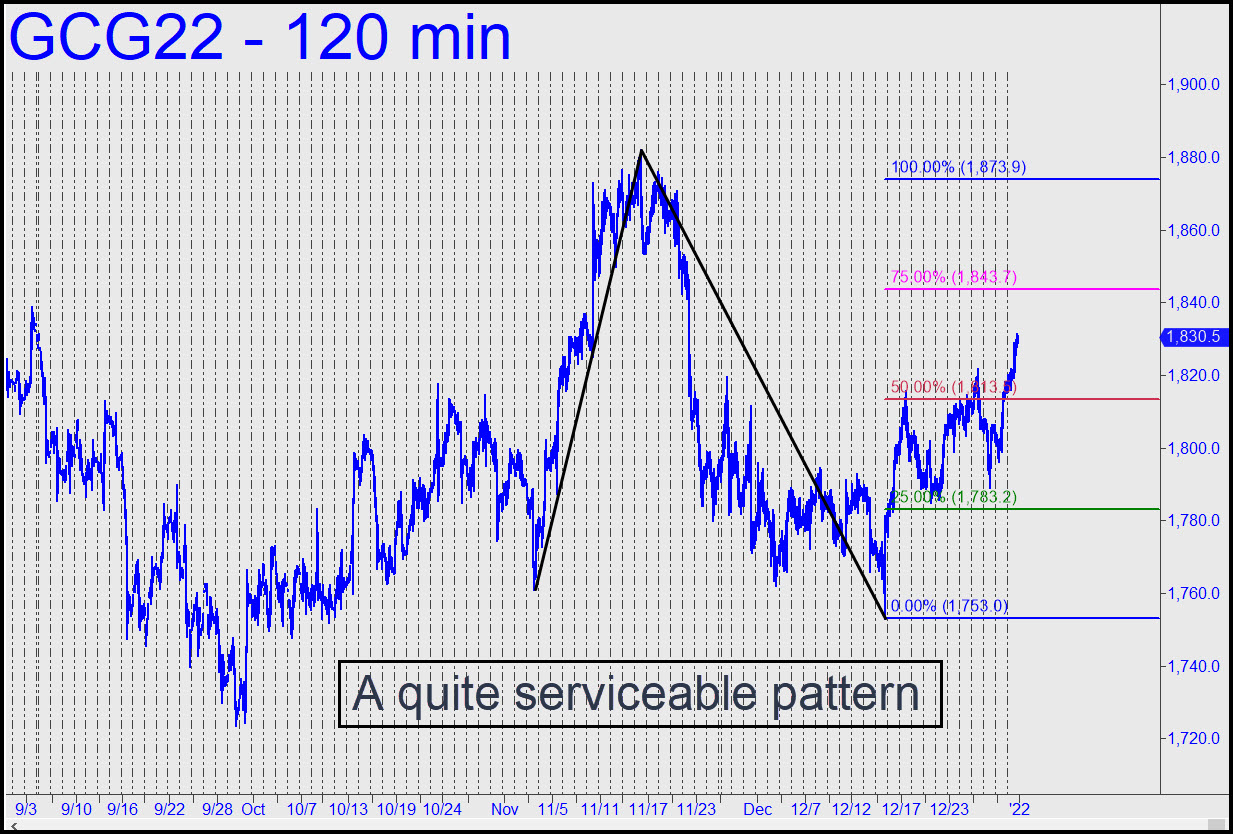
 I’ve come to view bullion’s rallies with cynical detachment, but that doesn’t mean we can’t exploit the gratuitous head-fakes, swoons and dives for trading purposes. The pattern shown should be up to the task, even if it failed to provide a ‘mechanical’ entry opportunity on either of two nasty feints to the green line. The pattern and the technique we use to leverage it ‘mechanically’ are too obscure to suggest we are getting front-run. Indeed, we should infer that gold futures are simply naturally nasty because they are controlled by some of the best-connected weasels in the trading world. We won’t try to short D=1873.90, only observe how well it repels buyers. ______ UPDATE (Jan 3, 10:03 p.m. EST): Much as I’d like to tune out gold, the little s.o.b. would trip a ‘mechanical’ buy signal if it falls to the green line (1783.20). With a stop-loss at 1752.90 and implied entry risk of around $3,000 per contract, this gambit is recommended for ‘camo’ experts only. To all others, I would suggest paper-trading so that you can better understand how these set-ups work. _______ UPDATE (Jan 4, 5:07 p.m.): Here’s a snack-size pattern to use for targeting and trading over the next day or two. It has triggered two ‘mechanical’ winners, but its main value now lies in its potential to measure trend strength via price action at D=1847.00. If you’ve made money on the way up, the target can be shorted with a very tight ‘reverse’ pattern that risks no more than $200 theoretical. _______ UPDATE (Jan 6, 8:04 p.m.): Perhaps you too are tiring of gold’s relentlessly annoying rallies and phony breakdowns? Does this vehicle suck, or what?
GCG22 – February Gold (Last:1791.40)
 Posted on January 2, 2022, 5:09 pm EST
Last Updated January 7, 2022, 12:10 pm EST
