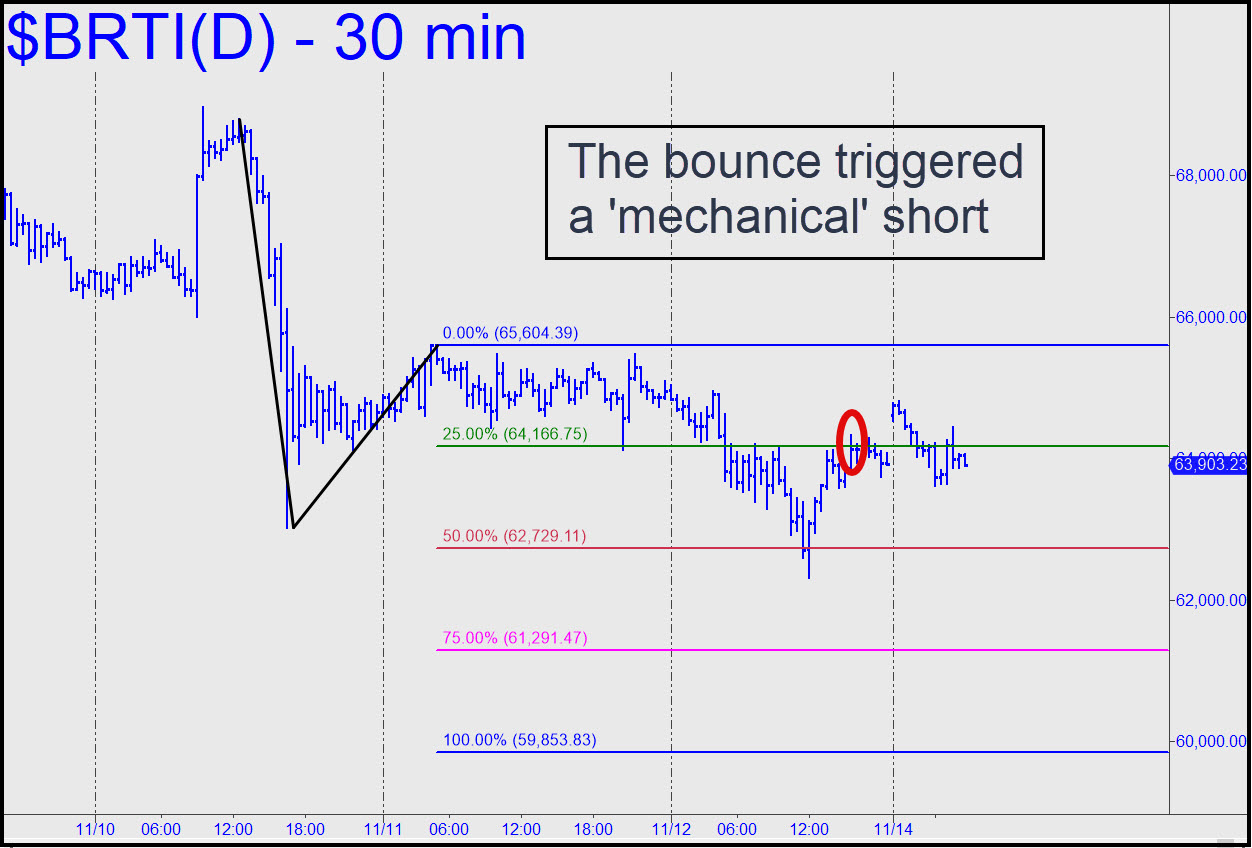
 The bounce on Thursday interrupted a punitive downtrend, triggering a ‘mechanical’ short at x=64,166 in the process. Bertie has only given one false ‘mechanical’ signal since I began tracking it several years ago, but it was a buy signal. I’ve mostly tuned out minor ‘sells,’ since it has been obvious all along that bitcoin was headed much higher. That is still the case, and I am sticking with the 89,780 bull-market target given here previously. But I am going to give the bearish chart shown the benefit of the doubt for now. If the ‘mechanical’ signal is correct Bertie should fall to at least p=62,729, but possibly to p2=61,291. I doubt the damage would be much worse than that, but if a plunge demolishes p, we’d have to take the possibility of d=59,853 being reached more seriously. _______ UPDATE (Nov 15, 7:10 p.m. ET): I’ve raised ‘C’ of the still-bearish pattern to the intraday high at 66,344. It suggests that a cautious bid at 63,111 could be used for bottom-fishing, but don’t risk more than relative pocket change. A decisive breach of this secondary Hidden Pivot would portend more slippage to at least p2=61,494. _______ UPDATE (Nov 16, 5:41 p.m.): For a very rare change Bertie actually exceeded a ‘d’ correction target. This development warrants our attention, but it is hardly the death knell for this lunatic-powered vehicle. If all remains (relatively) well, it should be easy to make money on the long side with ‘mechanical’ set-ups over the next couple of weeks. _______ UPDATE (Nov 18, 8:58 p.m.): The correction would need to hit 55,652 to equal the one in September. This reversal pattern implies Bertie can be bottom-fished with a tight ‘camo’ set-up.
BRTI – CME Bitcoin Index (Last:57,006)
 Posted on November 14, 2021, 5:10 pm EST
Last Updated November 19, 2021, 7:09 am EST
