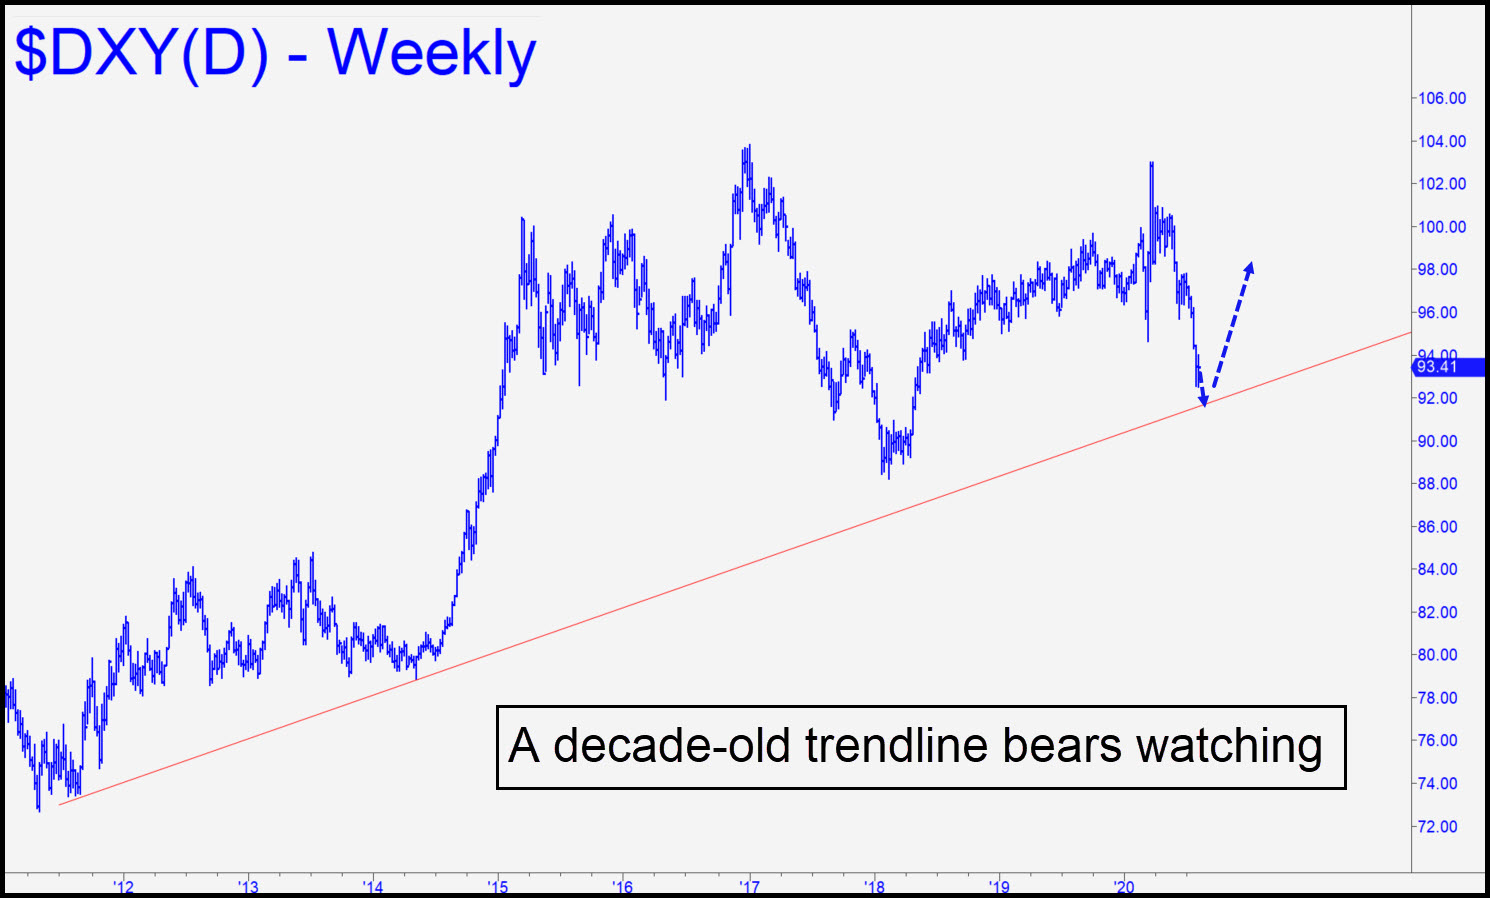
 The Dollar Index is closing on a long-term trendline that bears watching. It’s been six years since the dollar last fell to the line, implying this technical tool is not sufficiently well-developed to give us a confident basis for predicting a major reversal. But if one does occur it would mark an approximately 12% correction from the 103.82 high recorded in January 2017. An intervening rally in the 2018-20 period topped at the height of March madness before institutional investors settled on the rote themes that have dominated since then. Looking just ahead, if DXY were to connect with the trendline by late August, the touch-and-go landing we are looking for would occur at around 91.78. We’ll use this as a downside target for now, since it looks more promising than any Hidden Pivot support I could offer you. It would be more than a little useful to get this prediction right, since a trend change in the dollar would likely reverse all of the trends that have become entrenched over the last five months, including the bullish ones in gold, silver, the stock market, crude oil and copper. _______ UPDATE (Aug 18, 6:15 p.m.): The dollar looks horrible, but it will look even worse if it takes out the trendline noted above. It comes in around 91.74 this week. _______ UPDATE (Aug 20, 6:33 p.m. ET): A promising rally turned flaccid on day two, although not before poking above some minor peaks from earlier in the week to create a bullish impulse leg on the hourly chart. DXY would need to hit 94.21 to suggest something serious is happening.
DXY – NYBOT Dollar Index (Last:92.75)
 Posted on August 9, 2020, 5:11 pm EDT
Last Updated August 20, 2020, 6:32 pm EDT
