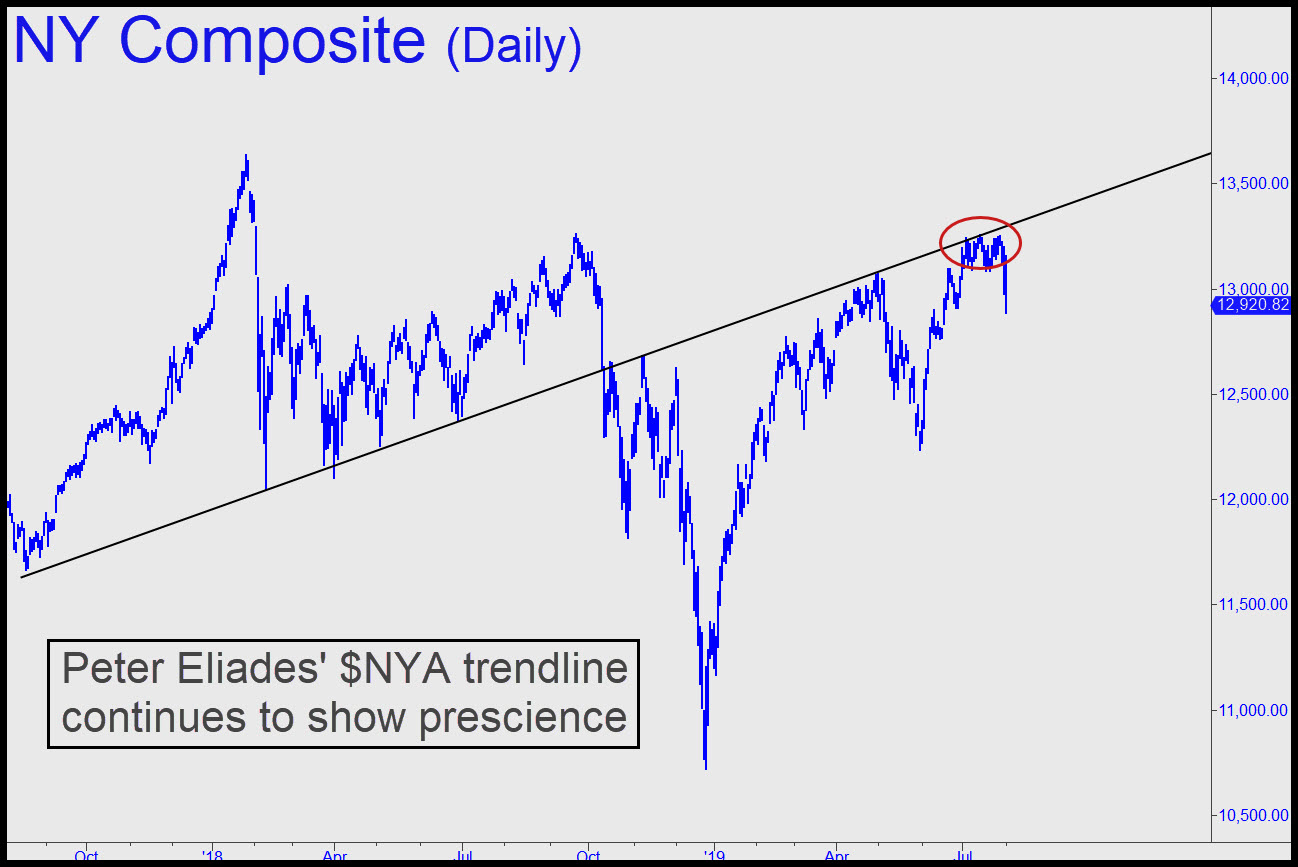
 On July 9, we ran a chart from our friend Peter Eliades of Stockmarket Cycles that showed the New York Composite Index head-butting a trendline whose provenance traces back to the 2009 start of the bull market. With the selloff of the last two days, the trendline appears to have racked up yet another prescient call (see graph above). Three separate attempts in July to get past it failed, and the resulting top is looking more important with each new wave of selling. If you count the number of times the trendline “worked” since last August, there were no fewer than five instances where it provided support, and then five since October where it acted as resistance. This is quite impressive and would become even moreso if the weakness we’ve seen this week starts to snowball.
Put Options Doubled
Peter’s trendline resistance closely coincided with a Hidden Pivot target for the E-Mini S&Ps at 3028.75 noted here on July 23. The actual top occurred three ticks above it, at 3029.50, allowing subscribers and Facebook followers to get short in timely fashion using DIA puts. Numerous subscribers reported ‘doubling out’ on those puts in the Rick’s Picks Trading Room today. By closing out half of their options for twice what they paid, the half of the position that remains is effectively free and riskless. Closing out half of every ‘doubler’ is a strategy we recommend for virtually all option trades. If you don’t subscribe but would like to follow the discussion in the Trading Room (and in the breezier Coffee House), take a free two-week trial subscription by clicking here. No credit card is necessary.

