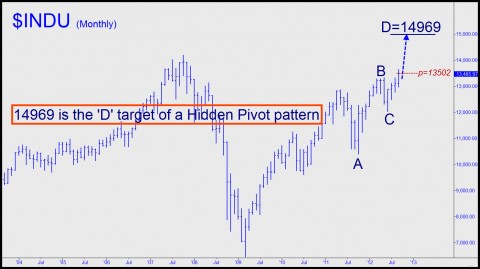
Our very bullish projection for the Dow Industrials, currently trading near 13485, calls for a powerful, last-gasp rally to 14969 before the elections. But what if the blue chip average were to simply fall from these levels without rallying to new highs? At what point would we give up on our target? asks a reader who goes by the handle “Mega-bear” in the Rick’s Picks forum. Before answering his question, we should mention that the trading “touts” and forecasts that are hidden from public view are much more finely nuanced than those you see trumpeted here occasionally in the headlines. (Click here for a free trial subscription to see how subtle and useful this information can be.) Moreover, and regardless of what the headlines would seem to imply, we are always prepared to turn on a dime, going from very bullish to sky-is-falling bearish if changes in the technical picture warrant it. That said, let’s looks at the technicals to see where things stand right now.
14969 is the rally target of the of the ABCD pattern shown above. By our lights – i.e., Hidden Pivot Analysis – a surge to that number became an odds-on bet when, two weeks ago, the Dow bulldozed its way past 13502, a “midpoint pivot” mathematically related to the D target itself. Notice in the chart that the first time buyers encountered the midpoint resistance, they showed no hesitation in pushing decisively past it. It is the ease with which they did so that boosted our confidence that the midpoint’s D “sibling” at 14969 would eventually be reached.
Importance of Minor Swings
Even so, there’s reason to be cautious, since a recent peak 13653 came very close to a secondary D target at 13639 that has the potential to be a major top. Considering the foregoing, and ignoring the fact that the world appears headed into synchronous recession, we still think the Dow could rally to 14969 before the bear returns with a vengeance. However, because we cannot be absolutely certain about this, we must monitor minor price swings in both directions very closely in order to detect even a slight change in bullish or bearish momentum that would precede an important trend change. Specifically, if minor abcd pullbacks routinely start exceeding their ‘d’ targets, that can mean the larger, bullish trend is starting to fail. Remember: every bear market begins with a single downtick off a bull-market high. By watching for this downtick at important ‘D’ rally targets, it is theoretically possible to nail important turns precisely even if there are higher targets outstanding.
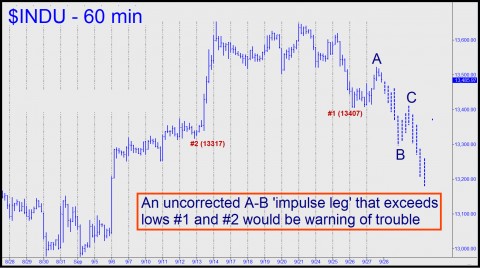
Finally, we’ll note that it would take a 1451-point drop to negate the 14969 target. Short of negating it, however, there are subtler signs we should look for that could warn of an impending plunge. Specifically, we’ll be looking on the hourly chart for any instance where a downtrending price bar or series of bars exceeds two prior lows without itself taking an upward abcd correction. Accordingly, in the chart immediately above, the crucial low lies at 13317 (#2). If an uncorrected series of price bars should exceed it after having breached 13407 (#1) we would consider that a very bearish sign and reef the sails accordingly — even as we keep an open mind about a reversal and further progress toward 14969.
[For further details concerning the Hidden Pivot Method, click here for a free trial subscription that includes access to Rick’s Picks 24/7 chat room and the just-launched ‘Harry’s Place’.]


Happy Anniversary!