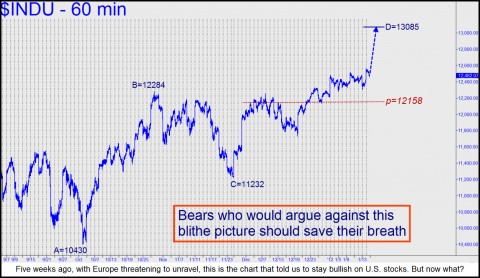
Stocks are creeping into the red zone, according to our proprietary technical indicators. A possible end to the Mother of All Bear Rallies begun three years ago? Perhaps. But rather than guess about such things, we’ll let the charts tell us what we need to know. We don’t have a crystal ball, after all, but we’ve learned that the stock market cannot change directions in any significant way without telegraphing the turn on the lesser, intraday charts. This they did back in January, when a pullback to a key ‘hidden” support signaled the big rally that was to follow. Specifically, using Hidden Pivot Analysis, we were able to tell subscribers to expect a Dow rally of at least 600 points, to a minimum 13085.
At the time, we were bearish as all hell on the real world. However, and as all traders come to understand, the stock market is unconnected to the events of the real world. Under the circumstances, trying to predict its ups and downs on the basis of the headlines is futile. Nonetheless, bearish as all hell, fearful of war in the Middle East and ever mindful of the economy’s fitful descent into Depression, we wrote the following in a Rick’s Picks “trading tout” disseminated to subscribers on January 18:
“Take any dozen good reasons for being bearish right now and they still don’t equal the bullishness of the chart shown [see above]. The undeniably compelling rally objective is 13085, a 4.8% move from current levels, and one can only surmise that the dusting the 12158 midpoint received on the last pullback (12/28) all but clinched a finishing stroke to the higher number. Moreover, it implies that bears shouldn’t get their hopes too high even if, in the next few days, the Dow plummets 324 points to retest the midpoint support. As of now, that would signal not weakness, but a screaming opportunity to get long. Hard to believe, really, but that’s what the charts say.”
Jettison Your ‘Beliefs’
Hard to believe, indeed. But we trade not on the basis of beliefs, but on hard facts; and the charts were pointing higher. So now what, with the Indoos settled above 13000 after hitting an intraday high on Monday of 13027? As implied above, we’ve hung out a yellow flag for subscribers, urging them to be extremely caution as the Dow traverses the final yards to 13085. We cannot predict what will happen when it hits that number, a Hidden Pivot, as seems all but certain. But we do know that it will be a good place to initiate speculative short positions. [Click here for a free trial subscription and a chance to witness the attempt in real time. You’ll also see why we are NOT so cautious on gold and silver right now.] We also know that a decisive penetration of the target, especially if it occurs within hours of the target’s being hit for the first time, would portend significantly higher prices. A runaway bull, as it were. Again, we would find this very hard to believe, even if the ongoing eurobailout hoax has bought another month or two of time. Whatever occurs, we’re prepared to dispense with what we “think” about the stock market and the real world, instead trusting charts that have rarely failed to keep us in synch with forces that will forever lie beyond logic and understanding.
(If you’d like to have these commentaries delivered free each day to your e-mail box, click here.)


Here is a link to a great article about Wall Street types facing economic reality because of bonus reductions.
http://tinyurl.com/7wucegj