Rick’s Picks occasionally publishes opinions with which we disagree. The inflationist argument below, bullish on stocks but also on gold and silver, comes from our savvy friend Chuck Cohen. On stocks, at least, if not on bullion, Chuck’s scenario goes against our own expectations, since we’re looking for a global economic bust that would send shares into a steep dive before year’s end. While this could also push gold and silver lower, we still expect precious metals to perform well in relation to all other classes of investables. Economic expectations aside, the broad averages have broken above the tedious sideways correction of the last six weeks, and the charts of many key stocks are undeniably bullish. There are also less-than-subtle signs that the Fed is eager to get QE3 under way with the explicit goal of pumping up stock prices. Keep these things in mind as you read Chuck’s contrarian take on the markets – a follow-up to a piece he did two weeks ago that we disseminated to paid subscribers. If you’d like to contact Chuck directly about his financial consulting services, or about mining stocks in particular, click here. RA]
Following the recent move up in stocks, I want to update my piece of October 4 (A Bottom Is At Hand) by making some comments regarding stocks, and more importantly to the gold community, about the disappointing lag in the precious metals.
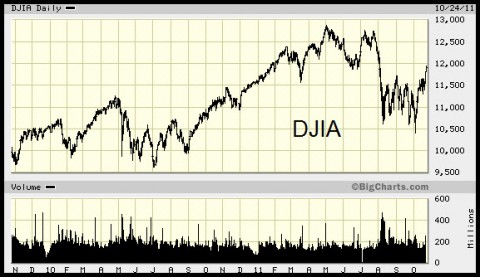
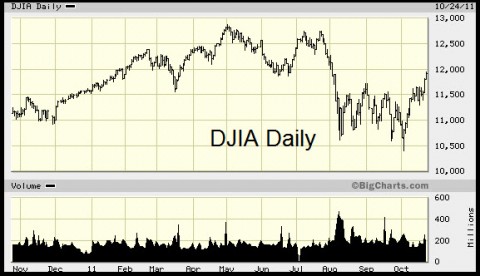
First, the stock market. In just two weeks, while the media and most investors continue to dwell gloomily on the financial landscape, the Dow has recaptured almost 1400 points (13%.) Today we are closer to the April high than we are to the recent low. In fact, both the market behavior and the Dow chart are remarkably similar to those of last year at the bottom in August. (The chart below shows how it unfolded from May 2010 to the end of August. Simply substitute 11,000 for 10,000.) And for those of us who have a short memory, the 2010 low came amidst an almost identical hysteria that a total collapse was at hand. At the very bottom, Death Cross and Hindenburg sightings were seen all over the globe and many were confidently predicting Dow 5,000 or worse. As I pointed out in my October 4 e-mail to clients, it is at such extremes of fear that major bottoms are made.
Reading the Tea Leaves
If I am reading the tea leaves correctly, the stock market is about to continue upward, fueled by the immense injection of liquidity. Inflation, not deflation, will soon be the byword from here. There are some other reasons why this should take place:
** Besides the negative extremes of the sentiment indicators, there has been a gigantic amount of cash taken out of stocks by the public. This tendency is normally seen as markets reach their final correction level.
** In addition, we are seeing an enormous degree of short selling, especially by hedge funds who coincidentally or not coincidentally were very short last August at the bottom. Historically, this kind of bearish action usually provides the fuel for the next up-cycle. I believe that most of the market players and experts are positioned the wrong way here, and a move through 12,000 will cause them to cover and put the withdrawn money right back into the equity markets.
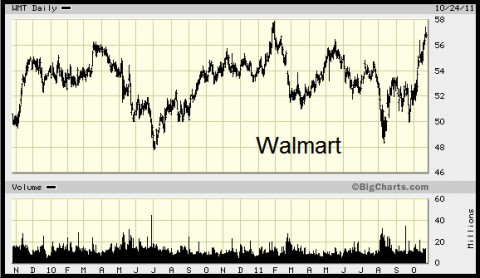
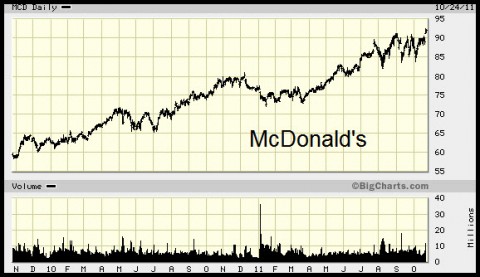
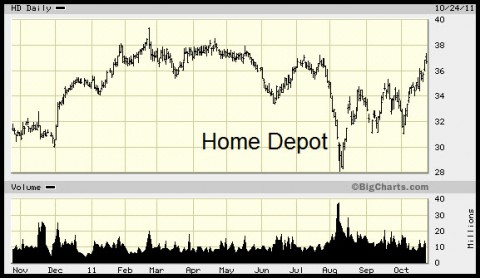
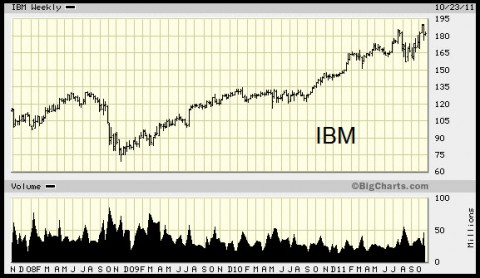
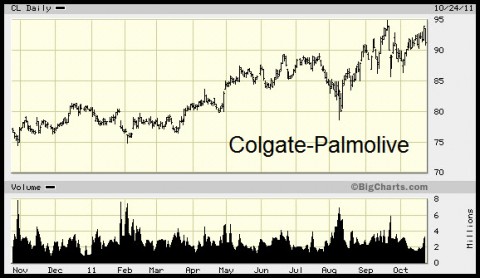
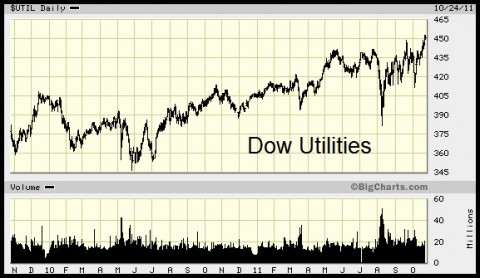
** Another huge technical positive that is rarely mentioned is the strength in many key stocks such as McDonalds, Colgate Palmolive, General Foods, Walmart, IBM, Home Depot, many of the utilities, and, amazingly, now even in the housing-related sectors. (Please do your homework and look at the charts. I have included a few of them below.) These are anything but negative patterns. If we were destined for a meltdown as feared, these significant stocks would be leading the market down, not up. I know it seems impossible but if these charts mean anything, we are entering some kind of world-wide recovery.
** One final point: The Occupy Wall Street gatherings. The looting of America actually occurred over two years ago, but isn’t it peculiar that the public is just now actively reacting to it? And it is at a time when the banking industry is anything but prosperous. Rather than applying a bearish tint to these meetings, I view them contrarily as positive, almost an odd-lot barometer. And considering how small they actually are, the media is giving them a disproportionate coverage as though we are witnessing the beginning of a modern French Revolution. As most of us have learned when the media actually notices something, it is usually irrelevant. I believe we will have blood in the streets one day, but it is still future.
The Bond Market
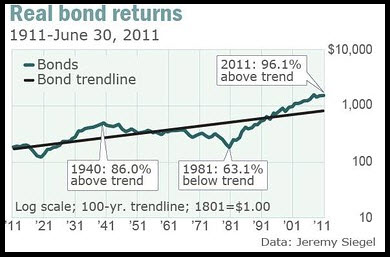
The most glaring casualty of a rising market and inflation should be the bond market. To me, bonds appear to be turning down, very likely precipitously. In fact, we could well be witnessing an historic inflection point of a bull market that has been in effect for 30 years. This bond chart goes way back, with nary a correction. If you don’t believe in central bank market intervention and manipulation then please try to explain how bond yields could come down persistently all through the past 30 years? Should bonds be finally changing direction, then my conclusion is something new is about to happen, most likely a flight out of fixed rate instruments and into fixed assets, very possibly including real estate.
Why Is Gold Lagging?
I have an explanation or at least a theory on the recent weakness in the precious metals. Since gold bottomed back in 2001 at $250, it has risen for different reasons at different times. In fact, I see two basic reasons for the ebb and flow of the price of gold: fear and liquidity. The one exception came back in 2002-03, as the stock market unwound from the speculative bubble of the 1990s and gold broke loose from its 20-year bear market. But since then, gold has normally followed the course of stocks, not gone against it, such as in 2008 (down) and August 2010 (up.) Both moves were factors of liquidity or a contraction of it as in 2008. We saw an exception last year in May and June when the stock market swooned, and gold went up in reaction to the fear of a collapse. But gold quickly retreated and then rejoined the stock market’s move, this time up in late August. This pattern held through the rise to 12,800 in the Dow.
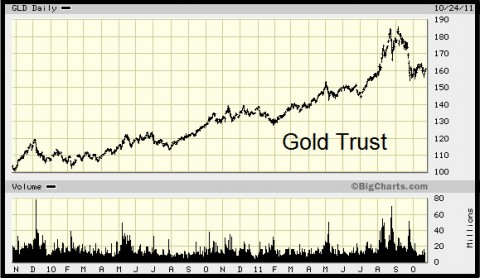
This connection continued until recently when the stock market rolled over and in late July dropped precipitously. Once again, as the market plummeted, nightmares of an imminent European collapse were everywhere in the financial media. And because of these fears, many investors, especially a lot of newcomers plowed into gold, and even more so into silver in a near-panic. The reasons for buying the precious metals, gold from $1,600 and silver from $35 had changed — from one of growing liquidity to one of near-terror. So when the stock market bottomed, the fear quotient once again began to seep out of the precious-metals buying, with gold, and more dramatically silver, retracing that final thrust from early August. Please examine the GLD and stock market charts below to see what I am getting at. I know this sounds confusing, but by comparing the Dow and the GLD chart, I hope you can follow my logic.
Just Ahead…
Now, if my assumptions are correct, we are entering a new phase, one marked by surprisingly strong recovery but accompanied by enormous inflation. So stocks should move up, and if the recent correlations hold, then the metals will once soon again turn up and then soar, as investors seek to shield themselves from an ever rapid depreciation of fiat money.
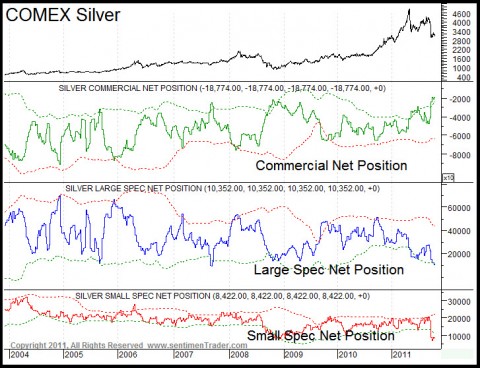
The major reason I cited in turning bullish on stocks a couple of weeks ago was the dramatic shift towards extreme pessimism. And now, gold and silver are exhibiting the same signs. In the October article, I included a couple of charts of the precious metals’ public sentiment from Sentiment Trader, and the extremely bullish Commitment of Traders charts. And recently, Bill Murphy’s Midas column reported that the latest gold and silver sentiment had become even more bullish. From such indicators are major bottoms found. MarketVane’s bullish consensus for gold slipped a point to 64% and silver’s dropped 4 points to 51%. These levels were last seen at the late-September low. In a more dramatic development, the HGNSI plunged 13.3 points to -13%. The HGNSI has only been negative three times this year, September 23rd-27th, June 30th/July1st, and January 27th/28th – all significant lows. The HGNSI has not actually been lower than this since March 16th/17th 2009.” And the Sentiment Trader public opinion polls show a sentiment very near the 2008 bottom, when gold hit $730 and silver $8.
On Friday, the commitment of traders report, continuing the positive trend of the past two months, confirmed this abysmal sentiment. So, right now the most predictive methods of the direction of the precious metals are close to the readings they were at the panic lows of 2008. Below is the COTs chart of silver. You can see that silver’s positions are actually now under the lows of 2008 when it hit $8.
My conclusion
Just as we found out last year in August when almost every columnist and advisor was obsessed with the specters of the Death Cross and the Hindenburg Omen, it is time to throw away your Prozac or Don Julio bottle and get ready for some fireworks. The end of all things is on schedule but it is not yet here. For some suggestions, please get in touch with me. Thank you. Chuck
Also, if you don’t have the October 4th piece, let me know if you wish it sent to you.
***
(If you’d like to have Rick’s Picks commentary delivered free each day to your e-mail box, click here.)

I am cautiously optimistic on the markets for no other reason than the DOW has met or beat six Hidden Pivot midpoint targets dating back to 1987. The SPX has met or beat seven midpoint targets dating back to 1985. It doesn’t guarantee we’ll go higher from here, but it certainly doesn’t hurt. Time would have to be factored into the equation as we move further back in time, but we should at least acknowledge there is the distinct possibility the markets could quite easily recapture the bear market highs from earlier this year. It may be improbable, but it isn’t impossible.