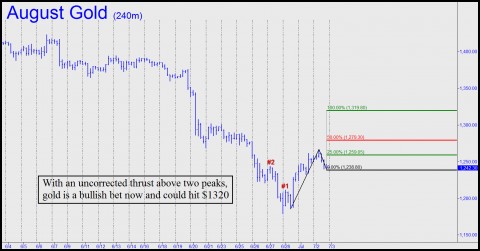
Despite yesterday’s weakness in gold, technical signs remain as bullish as they’ve been in months. In the chart below, notice how the rally off last Thursday’s low exceeded two prior peaks (#1 and #2). This surge represents a bullish “impulse leg,” according to our Hidden Pivot System, and the last time one occurred, back in April, it predicted a $100 surge. This time, however, the impulse leg looks even more promising, since the two peaks exceeded were more challenging than the ones surpassed last spring. The implication is that once the rally has been fully corrected, August Gold will take another leg up that is equal to or greater than the $81 leg just completed. In theory, however, before this happens, the futures would need to pull back by at least $16 to be fully recharged. Tuesday’s $28 pullback more than met that requirement, and although there could be more backing and filling in the days ahead, from this point forward August Gold is good to go for an $81 thrust.
To be sure, there are cautionary flags out at the moment, since the recent bear market low at $1179 exceeded a key Hidden Pivot support of ours by $40. This suggests that weakness will return during the summer. However, we’ve learned to keep an open mind concerning our technical indicators and to never chisel our expectations in stone. More immediately, though, gold looks like a bull play on a time horizon of about 5-7 days. Assuming yesterday’s 1238.30 bottom survives, the countdown for the $81 thrust would begin at exactly 1259.10. Getting long at that price would still be risky, however, since placing a stop-loss in the obvious place – i.e., beneath yesterday’s 1238.30 bottom — would imply entry risk of more than $2000 per contract. In practice, we would use our proprietary “camouflage” trading method to get aboard, with the goal of reducing theoretical entry risk to about $40-$50 per contract. If you’d like to find out more about this tactic, click here.


I’m late on this comment but after reading the article and sifting through the reader comments it appears the view here is isolated mostly to the USA.
One may wish to start thinking globally and include world demand into your criteria of assessment otherwise you may get caught behind the curve.
&&&&
On the one-minute charts that we pore over, Paul, one is never going to be more than mere seconds “behind the curve.” RA