[We’ll finish out the week with the commentary below, since it has generated such a lively response. If you’re interested in Bitcoins, a popular form of digital currency, be sure to click on the link beneath forum remarks from ‘Robert’ on the subject. It will take you to Max Keiser‘s web site, where the discussion really took flight. Regarding gold, this week’s price action has left me quite confident that the Comex June contract is on its way down to at least $1487. However, although I have plenty of company in the bearish camp, I don’t see this selloff getting much worse than that, at least for now. A detailed technical assessment is contained in a trading ‘tout’ for June Gold that I have made publicly accessible below. RA]
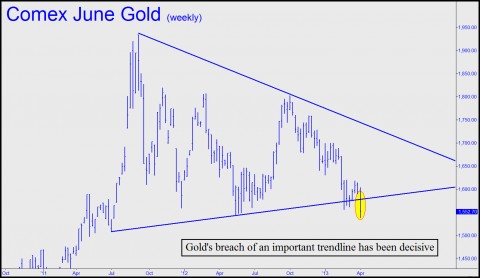
With a scary bank crisis in Cyprus driving the headlines a couple of weeks ago, gold could barely muster a rally. Notice in the chart below that the high of the move failed to clear a minor peak at 1619.70. Had it done so, we would have given bulls a fighting chance, since it would have created a bullish “impulse leg” with the potential to power quotes as much as $120 higher in just a few weeks. Instead, buyers showed themselves to be gutless, allowing the April contract to relapse down to within inches of the lower trendline. It could hold, but we doubt it. [Note: I have updated the chart to show that the breakdown we’d expected has in fact occurred, and decisively.]
Still worse is that a breakdown is likely to send the futures down to at least 1553.50, a Hidden Pivot support identified here a couple of weeks ago when the futures were trading above 1600. If that “hidden” support should fail as well, look out below, since the next stop would be a more important one at 1487.00 that was flagged at the same time. That would represent a 5.5% fall from current levels, which would hardly be disastrous. But it would also turn a trendline that has provided support since July of 2011 into resistance, opening a path to significantly lower prices into autumn.
Three Scenarios
Because the trendline is so clear, it seems all but certain to be tested. It comes in at around 1570 this week, and you should expect it to be breached. Once that has occurred, things could play out in a few different ways. Most bullish of them would be a sharp rebound that vaults the 1619.70 peak by mid-April. That’s what we should expect to happen if the smart money is planning to shake out the weak sisters in order to run gold steeply higher without being burdened by nervous profit taking. But if gold proves unable to get serious loft within a week or two, be prepared for a downdraft to 1487.00. Another possibility is a tedious game of footsies on and around the trendline. Beware, however, if settlement occurs below the trendline for two consecutive weeks, since that would imply distribution.
Because the long-term trend in gold is bullish, we should be willing to give it the benefit of the doubt under any circumstances. Technically speaking, it would take an “impulsive” rally on the hourly chart to turn us bullish again. At present, that would imply a swift thrust hitting 1612.90 within three or four days of any fleeting dip below the trendline. We’d lay three-to-one odds against it at the moment, but stranger things have happened.


To TC above – yes, I am sure even at todays prices the physical metal can be found, thanx. I was just relaying what I was told from a fairly large bric/mortars local dealer on the west coast. 9 to 1 buyers over sellers, preimums had risen some and actually, I believe, 90% silver was difficult to find. So the take away here IMHO is these prices have not yet at these levels dampened many spirits….actually seems contrary. Usually in the past it was mostly the ‘buy high & sell low’ mentality moving in mass in and out of his shop on ‘the panic mode’. Buy on the panic up and sell on the panic down…..I have actually seen that theory in practice for several decades and there was some general truth to it. Perhaps something is different this time…..